For the nature of the chemical bond is the problem at the heart of all chemistry.
Bryce Crawford, Jr., 1953
While the previous chapter has covered the theories which underlie all of the calculations in my thesis, this
chapter addresses more detailed issues, specifically where I have developed a new understanding or parameterisation.
The new field of linear scaling theories in tight binding has been touched on in Chapter 2, and the mathematical
basis for several of these theories has been explained. In the first part of this chapter, the results of an investigation
into the suitability of these different methods for calculating energies and forces for different systems are presented,
using tests which identify the best method to use for the calculations in my thesis. After that I describe the concept
of a tight binding parameterisation, and detail three parameterisations which I have fitted (for bonds
between Si atoms, between Si and H atoms and between Si and Bi atoms - all of which are extremely
relevant to silicon growth: the first two to the growth from hydride gas sources, and the last to surface
properties).
In this section, the results generated from the methods described above in sections 2.4- 2.6 are compared for
different systems. The tests have been performed for energy convergence, force convergence and efficiency (i.e. time
per step for a given level of accuracy) for an insulator (carbon), a semiconductor (silicon), a metal (titanium) and a
molecule (benzene), though several of the tests will not be presented here for reasons of space. The full set of
comparisons can be seen in Bowler et al. (1997). All of the graphs, except for the efficiency plots, have a similar
form which might be considered confusing, and so I will spend a little time explaining how the results have been laid
out.
When calculating a given moment, there are many contributions from the different possible paths, as explained
in section 2.6. For instance, the tenth moment of a system has contributions from the path which takes five hops
away from atom i, and then five hops back again along the same path, as well as the path which consists of hopping
to a given nearest neighbour, j, and back again five times, as well as many others. It is possible to
evaluate only those moments which fit within a cluster of a given size, so that the order of the moment
calculated can be increased without increasing the cluster size; this fits well into the linear scaling
justification presented in section 2.4. (So-called exact moments correspond to evaluating the moments
up to that moment which defines the cluster size - so, for instance, up to the eleventh moment in a
five hop cluster). On the graphs, there are five boxes containing plots, which correspond to clusters
made by hopping away from the central atom between three and seven times. For the density matrix
method, the cluster size defines the cutoff radius of the density matrix; the x-axis has no significance. For
the moments methods, the x-axis denotes the number of moments evaluated used within that cluster
size.
All of the results in this section are presented as errors relative to the value calculated using an exact
diagonalisation of the Hamiltonian in k-space, which was fully converged with respect to k-point sampling, and not
relative to an ab initio or experimental result. One of the main aims here is to investigate energy difference
convergence, rather than absolute energy convergence, as the bulk of the work in this thesis is in comparing the
energetics of different structures.
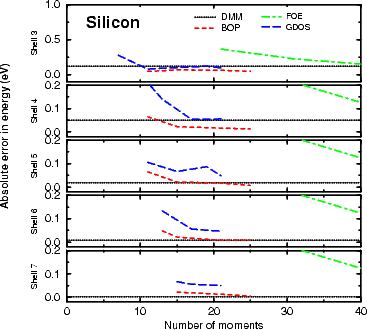
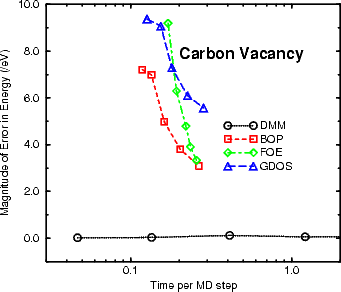
Figure 3.1 shows the error in the binding energy for carbon. As it is an insulator, with extremely
localised bonding, all of the methods would be expected to converge well with it, and this is indeed the
case. By five hops, and twenty moments where applicable, all methods are converged, except for FOE.
As will be seen, FOE requires more moments to converge, but can achieve them extremely quickly.
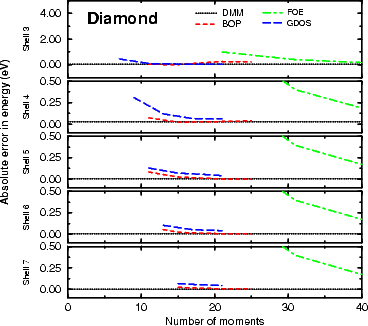
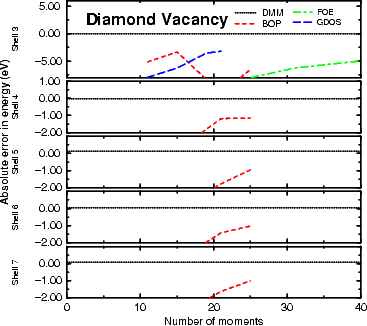
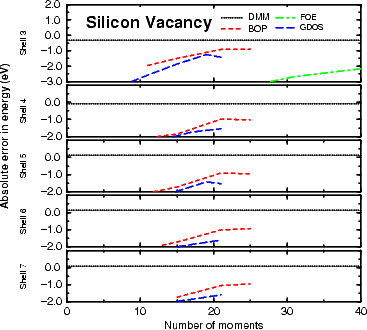
Figure 3.2 shows the absolute error in binding energy for silicon in the diamond structure. As it is a
semiconductor, it should take larger clusters to converge the energy than for diamond, and this is indeed what is
seen. The convergence is good at five levels, and excellent by seven, with 20 moments entirely adequate for the
moments methods.
The vacancy formation energies shown in Figures 3.3 and 3.4 are for unrelaxed vacancies, and are calculated for
63 atom unit cells (i.e. 64 atom perfect bulk cells with one atom removed). The energy is found by
subtracting 63/64×(energy for the bulk unit cell) from the energy for the vacancy cell. As can be seen
from both figures, the DMM is the only method which is even close at any cluster level, and is well
converged at three hops, and extremely well converged at five. It is this result (that energy differences
are well converged) which justifies use of three hops for the calculations to be performed throughout
this thesis. The explanation for the difference between the methods lies in the fact that moments
methods have difficulties resolving narrow features in the density of states (Kress and Voter 1995),
while the DMM does not. The density matrix found in the DMM is exact within the limits of the
approximation; this means that it will resolve sharp features well, where moments methods will have to include
extremely high moments to achieve such resolution. It is important to note that the sign and magnitude of
the error for the DMM varies because the value plotted is a difference in energies, and is no longer
variational.
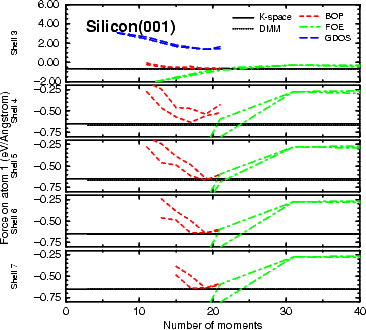
There are two key questions to be addressed when considering the forces which a
method produces: whether the Hellmann-Feynman theorem is obeyed (i.e. whether the forces calculated analytically
match the numerical derivatives of the energy as discussed in Chapter 2); and whether the forces
match the k-space well enough to reproduce MD results. The graphs shown in Figure 3.5 answer this
question for the z-force on an atom on the unreconstructed Si(001) surface, though in a slightly confusing
manner. On the graph, the solid black line is the k-space result, while for the three O(N) methods, there
are two lines each: the analytic force and the numerical force. If the two lines for a given method do
not match, the Hellmann-Feynman theorem is not satisfied and there will be difficulty in stating the
energy achieved in a relaxation calculation, and great difficulty in achieving energy conservation during
MD runs. Fig. 3.5 shows that the force from the DMM is almost indistinguishable from the force in
k-space, whereas the moments methods have grave difficulty on both fronts, though FOE achieves good
consistency.
The final question to consider when deciding which of the linear scaling methods to use concerns efficiency: how
long a given method takes to reach a given level of accuracy. For the purposes of the work in this thesis, the
diamond vacancy formation energy has been considered, and is shown in a logarithmic plot for time in Figure 3.6.
From this, it is clear that the only method of choice for insulators and semiconductors, particularly when there are
gap states, is the DMM, and this has been used throughout.
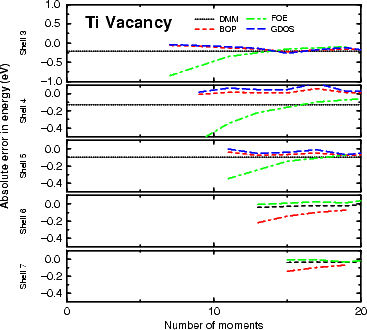
The above sections may have left the reader with the impression that the
DMM is the only linear scaling tight binding method to use. This is hardly a fair impression to leave; the examples
shown above were designed to test the systems to be considered in this thesis, and not all of the systems which
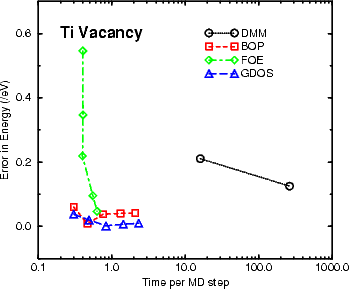
could be modelled. In Figure 3.7, the vacancy formation energy for hcp titanium is shown; while DMM is performing
as well as any of the other methods for this system, there are two drawbacks. Firstly, as can be seen in the figure,
beyond five shells the results stop; for clusters larger than this, the DMM requires above 256 MB of memory,
which is not available in the MML, whereas the other methods had memory spare even at 7 levels.
The second drawback of the DMM can be seen in Figure 3.8, where the efficiency for the titanium vacancy
formation energy is plotted. The graph makes its own point, though it is worth noting that of the moments
methods, BOP or FOE are probably the methods of choice for this kind of calculation; if simplicity of programming
and understanding is the aim, then FOE is the method to use, whereas for greater flexibility and potential accuracy,
BOP has the edge.
As well as the choice of method, as discussed above, the parameterisation used for a tight binding calculation
strongly affects the success of the calculation. There are various issues which need to be addressed: what the
parameterisation has been fitted to; how transferable the parameterisation is; what form is used for the
scaling of the parameterisation; and how applicable the parameterisation is to the situation being
modelled. It is possible that in several years time, the whole question of fitting a parameterisation
may be academic with the development of so called ab initio tight binding methods, such as Sankey
and Niklewski (1989). This class of methods explicitly constructs basis functions on each atom in
the system, and then tabulates their integrals for a large range of separations. The Hamiltonian is
generally set up using a Harris-Foulkes type approach (in which the superposed atomic charge densities
are used as the input to the Kohn-Sham equations, and self-consistency is neglected), before being
diagonalised using standard methods. Thus the Hamiltonian is still parameterised, but based on ab
initio methods.
In general, when constructing a parameterisation, there are three areas which must be addressed: the electronic
parameters (which are generally fitted to bulk properties, such as band structure), the scaling parameters (which
represent how the electronic parameters change with distance) and the repulsive potential (which
represents everything which has been neglected until now, and is generally taken to be a pairwise
function). The electronic parameters include the on-site energies (e.g. Es and Ep) and the hopping
parameters (e.g. hss , which describe electronic transitions). The scaling parameters multiply the
equilibrium eletronic parameters and the repulsive potential; a variety of forms for scaling will be discussed
below.
, which describe electronic transitions). The scaling parameters multiply the
equilibrium eletronic parameters and the repulsive potential; a variety of forms for scaling will be discussed
below.
In the original tight binding paper by Slater and Koster (1954), only the electronic part of the parameterisation
was covered. They provided a table which gave all possible two centre integrals between s, p and d-like orbitals,
based on particular symmetry relations (for instance, a px orbital will have  and
and  components to its overlap with
another px orbital). For two atoms at points Ri and Rj, with direction cosines in the direction Rj-Ri
given by l,m and n, then the Hamiltonian elements between different orbitals on i and j are shown
in Table 3.1. It is these relationships which were referred to in section 2.3, when considering orbital
overlap.
components to its overlap with
another px orbital). For two atoms at points Ri and Rj, with direction cosines in the direction Rj-Ri
given by l,m and n, then the Hamiltonian elements between different orbitals on i and j are shown
in Table 3.1. It is these relationships which were referred to in section 2.3, when considering orbital
overlap.
|
| | Hs,s | hss |
| Hs,x | l. hsp |
| Hx,x | l2. hpp - (1 - l2). hpp |
| Hx,y | lm. hpp - lm. hpp |
| Hx,z | ln. hpp - ln. hpp |
|
| | |
| Table 3.1: | The Hamiltonian elements between two atoms (i and j) for s and p-like orbitals. Note that x,y
and z refer to px, py and pz orbitals, and that l,m and n are the direction cosines between atoms i and j.
After Slater and Koster (1954). |
|
Slater and Koster fitted the Hamiltonian matrix elements to ab initio calculations of band structure, at certain
high symmetry points in the Brillouin zone. The paper considers the band structure of various different materials,
and looks forward to the kind of calculations being performed today. It is a marvelous example of how a scientific
paper should be written.
Chadi and co-workers (Chadi and Cohen 1975; Chadi and Martin 1976;Chadi 1977; Chadi 1979a,b) developed
tight binding parameters for silicon, germanium, gallium arsenide and other III-V semiconductors. The method
assumes a scaling of the hopping parameters as d-2 for two atoms (i and j) separated by a distance d (this is similar
to the method of Harrison (1980), which is discussed in the next paragraph) and a repulsive term which had no
equilibrium value, U0, but was given by:
| (3.1) |
where  ij is the fractional change in bond length. U1 was fitted so that the total energy was at a minimum for
the equilibrium volume, and U2 was fitted to give accurate harmonic forces, so as to give good results for elastic
constants and transverse phonons. The final version of the silicon parameterisation (Chadi 1979c) gave good results
for the (001) surface, but the bulk modulus was still wrong. Chadi and his co-workers fitted to data from x-ray
and photoemission band spectra, and ab initio band structure results, though they acknowledged
that they could only fit the valence band and not the conduction band with a nearest neighbour, sp3
model.
ij is the fractional change in bond length. U1 was fitted so that the total energy was at a minimum for
the equilibrium volume, and U2 was fitted to give accurate harmonic forces, so as to give good results for elastic
constants and transverse phonons. The final version of the silicon parameterisation (Chadi 1979c) gave good results
for the (001) surface, but the bulk modulus was still wrong. Chadi and his co-workers fitted to data from x-ray
and photoemission band spectra, and ab initio band structure results, though they acknowledged
that they could only fit the valence band and not the conduction band with a nearest neighbour, sp3
model.
Froyen and Harrison (1979) compared the band structures produced by linear combination of atomic orbital
(LCAO) theory and free electron theory, and using certain selected differences in energy from these two
methods found a universal formula for hopping elements in terms of a dimensionless coefficient  ll'm,
ll'm,
| (3.2) |
where d is the distance between ions and m is the mass of the electron. This method works extremely well for
semiconductors in the tetrahedral structure, but not for close-packed structures (Paxton, Sutton and
Nex 1987). The whole bond orbital model of Harrison is well described in his book on the subject
(Harrison 1980), where he derives the d-2 scaling of hopping parameters, and also the d-4 scaling
of repulsive terms, which form an alternative to the repulsive model used by Chadi and described
above.
One of the most successful tight binding parameterisations is that of Vogl, Hjalmarson and Dow (1983). (A
useful, and increasingly common, measure of the success of a scientific paper is the citation count - Vogl, Hjalmarson
and Dow has been cited over 600 times). Two things were shown in their paper: that the hopping parameters could
be fitted to high symmetry points of band structures; and that adding a single, excited state (which they call the s*
state) can greatly improve the bottom of the conduction band, and thus the shape of the gap. In
their paper they give parameters for sixteen tetrahedral semiconductors (from carbon, silicon and
germanium through to zinc telluride) all of which correctly fit the value and direction (in k-space) of the
gap.
A major concern with all tight binding parameterisations is that of transferability: how well a
parameterisation will perform in an environment which is different to that used for fitting. This problem was
addressed by Goodwin, Skinner and Pettifor (1989), who produced a nearest neighbour, orthogonal
tight binding parameterisation for silicon which fitted well to the diamond phase and reproduced the
energy and volume differences for the beta-tin, simple cubic, fcc and bcc phases reasonably well. They
achieved this by increasing the Es to Ep separation beyond that expected physically (Chadi had 6.45 eV,
Harrison 7.03 eV and GSP 8.3 eV) and introducing a rescaling of the hopping parameters, shown in
Eq.3.3.
| (3.3) |
The next three sections cover three parameterisations which have been developed in the course of this thesis, for
interactions between Si atoms, between Si and H atoms, and between Si and Bi atoms. There are already several
parameterisations for both Si-Si and Si-H bonds which are used in the literature (e.g. Chadi (1979c), Goodwin,
Skinner and Pettifor (1989), Kwon et al. (1994), Min et al. (1992) and Panzarini and Colombo (1994)); it might be
reasonable to ask why another parameterisation is necessary. The answer which emerges is that the
parameterisations which are available are all unsuitable in one way or another for the systems which are to be
studied in this paper. There was, however, no parameterisation available for the Si-Bi work planned, and the work
presented is alone in the field.
The parameterisation of Goodwin, Skinner and Pettifor (1989) (GSP) was designed to fit to various phases of silicon
at equilibrium bond lengths - notably including the metallic phases. This was achieved in the simple sp3,
orthogonal tight binding model by artificially increasing the separation between Es and Ep beyond
that appropriate for the tetrahedral structure; unfortunately, the increased separation weakens the
-bonding of silicon dimers on Si(001) and renders it unsuitable for modelling the chemistry of the Si(001)
surface. The weakening can be seen quite simply by modelling two unit cells: a clean Si(001) surface,
and a Si(001) surface with one hydrogen adsorbed on one end of a dimer. The dimer which has had
hydrogen adsorbed on one end should be longer, as the -bond in the dimer has been broken (and,
indeed, in the LDA modelling described in Chapter 6, the bond length for a clean dimer is 2.28 Å, and
for a partially hydrogenated dimer 2.43 Å). Unfortunately, the GSP parameterisation predicts that
the bond shortens when a hydrogen adsorbs; this suggests that the next available orbital after the
-bond is the * anti-bonding orbital, which is emptied when the hydrogen adsorbs, leading to the
shortening.
The early parameterisation of Chadi (1979c) described the band structure rather well, and had the correct
separation of Es and Ep, but gave poor elastic constants, due to the assumption of 1/d2 scaling (see
Goringe (1995) for further discussion of this point). The parameterisation of Kwon et al. (1994) is
rather more complicated, and uses a cutoff which is more than nearest-neighbour, which degrades the
performance of linear scaling methods enormously. This parameterisation and the GSP parameterisation, in
attempting to be transferable to all phases of silicon, are less suited to a detailed study of one aspect
of silicon chemistry. For this reason, a new parameterisation was created specifically for the Si(001)
surface.
The aim of the parameterisation presented here was to reproduce well the chemistry of the Si(001) surface, as
well as bulk Si. This led to a number of requirements: a good fit to the bulk band structure; good elastic
constants; the correct separation of Es and Ep; and accurate reproduction of small distortions of the
structure. As Chadi’s parameterisation has the correct separation of Es and Ep, and reproduces the band
structure well, the values he chose for the energy levels and hopping parameters were adopted. The scaling
rules must now be fitted; the GSP form for scaling (Eq.3.3) was used, and the following criteria fitted
to:
1. The diamond and  -tin structure absolute volumes
2. The diamond--tin energy difference
3. The bulk modulus, C' and C440
|
|
|
|
|
|
| | Es | Ep | hss | hsp | hpp | hpp |  0 0 |
|
|
|
|
|
|
| | -12.2 | -5.75 | -1.938 | 1.745 | 3.050 | -1.075 | 3.44566 |
|
|
|
|
|
|
| | |
|
|
|
|
|
|
| | r0 | rc | dc | n | nc | m | mc |
|
|
|
|
|
|
| | 2.35 | 3.8661 | 3.8521 | 1.9771 | 6.8702 | 4.7104 | 7.0531 |
|
|
|
|
|
|
| | |
| Table 3.2: | Parameters for Si-Si interactions. All energies are in eV. |
|
|
|
|
|
|
|
|
| | Source | Diamond | | -tin | | | Elastic constants | |
|
|
|
|
|
|
|
| | | a0 | Energy | a0 | Energy | B | C' | C44o |
|
|
|
|
|
|
|
| | TB | 5.43 | 0.00 | 4.842 | 0.266 | 0.998 | 0.363 | 1.099 |
| Expt/LDA | 5.43 | 0.00 | 4.822 | 0.266 | 0.990 | 0.510 | 1.110 |
|
|
|
|
|
|
|
| | |
| Table 3.3: | Fitting results for the silicon-silicon interactions. Energies are in eV, lattice constants in Ångströms
and elastic constants in Mbar. |
|
This fitting yielded the parameters shown in Table 3.2. The quality of the fit is shown in Table 3.3. Various tests
of the model, which involved both Si-Si interactions and Si-H interactions, are given in the next section. It is
worth noting here that the fit is extremely good, except for the C' constant, though this is nothing
unusual - it is normally at least this far off in a minimal basis set. With this exception, the fit is almost
perfect.
As has been explained above, it has been necessary to create new parameterisations for Si-Si and Si-H, although
such sets already existed. The reasons for the rejection of the Si-H parameterisations now follow. The
parameterisation of Panzarini and Colombo (1994) for H-Si interactions uses the GSP silicon parameterisation, and
thus will not work well at surfaces for two reasons: firstly, because the Si-Si bonds are poorly described, and
secondly because the gap between the silicon Es (or, equivalently, the silicon Ep) and the hydrogen Es will be
incorrect. Also, they did not fit the scaling terms to any H-Si stretched bonds, which is appropriate for the bulk
diffusion they were investigating, but is inappropriate for surface diffusion. The parameterisation of
Min et al. (1992) used poor Si-Si parameters, and was not fitted to extended bonds. Again, a new
parameterisation was created to fit to the following situations: extended bonds, and interactions at the Si(001)
surface.
In the SiH4 molecule, the only bonding involved is between Si and H. As it is also tetrahedral, the molecule is ideal
for modelling Si-H interactions. The electronic eigenstates are available from experiments; theoretically, the Hamiltonian
for the silane molecule can be solved analytically; the bonding (sb,tb) and anti-bonding (ta,sa) eigenvalues are given
by1:
These can be inverted, to give the hopping parameters in terms of the energy levels of hydrogen and silicon. The
hopping parameters will be written in terms of the bonding eigenvalues, and the onsite energies for silicon and
hydrogen:
![V~ ------------------------------
hsss = 1- [(ESi + EH )- 2sb]2- (ESi- EH )2 (3.8)
16 s s s s
V~ -------------------------------
hsps = 3- [(ESpi+ EHs )- 2tb]2 - (ESpi- EHs )2 (3.9)
16](Master107x.gif)
If no energy zero is defined, then there are three energy differences available for fitting (e.g. sa - sb, and the other
levels relative to sb), and three variables to fit (EsH, hss and hsp). A perfect fit to these requires
the silicon Es and Ep splitting to be reduced to 5.45 eV; as the Si-Si parameters have already been
fitted, with the splitting between Es and Ep fixed at 6.45 eV, the requirement for reducing Esp will be
disregarded. As the simple tight binding model which is being used rarely reproduces excited states
well, only the occupied (bonding) eigenvalues will be fitted to, as shown in Eqns 3.8 and 3.9, which
should not greatly affect the quality of the modelling. The other electronic degrees of freedom are
the separation of the hydrogen Es and silicon Es levels, and the absolute level of the silicon Es level
relative to the experimental eigenspectrum (all other energy level are taken relative to the silicon
Es). The scaling of the Si-H bond for small displacements was fitted to the binding energy curve for
the silane molecule. The final degree of electronic freedom (the absolute level of the silicon Es level)
can be understood more easily when it is noted that the hopping terms, hss and hsp, depend on
EsSi.
The experimental data being fitted to are the eigenvalues of the molecule and the frequency of the symmetric
bending mode. The other data come from ab initio calculations: the binding energy curve about equilibrium from a
fully self-consistent LDA calculation There are two electronic degrees of freedom (the absolute position of the silicon
Es level, and the relative position of the hydrogen Es level with respect to the silicon Es level), which are fitted to
four pieces of data, while there are seven scaling degrees of freedom (using GSP scaling as shown in Eqn. 3.3, there
are n, nc and rc for hopping and repulsive terms and 0) which are fitted to a 26 point binding energy
curve.
The parameters from the fitting are shown in Table 3.4. In this situation, the GSP-style rescaling is used
to obtain a clean cutoff at 3.4 Å (a requirement found from fitting to extended bonds; the simple
d-n scaling for the hopping and repulsive parameters reproduced the binding energy curve extremely
well, making the GSP terms redundant). The tests of the parameterisation are described in the next
section.
|
|
|
|
|
|
| | Es | Ep | hss | hsp | hpp | hpp | 0 |
|
|
|
|
|
|
| | -8.4 | N/A | -3.834 | 4.734 | N/A | N/A | 7.4399 |
|
|
|
|
|
|
| | |
|
|
|
|
|
|
| | r0 | rc | dc | n | nc | m | mc |
|
|
|
|
|
|
| | 1.474 | 3.4 | 3.4 | -2.6752 | 20.0 | -4.2302 | 20.0 |
|
|
|
|
|
|
| | |
| Table 3.4: | The parameters for Si-H interactions. All energies are in eV. |
|
The fitting to extended bonds is somewhat harder; in the end, I have chosen to fit to a fictitious reaction. I have
used the process of SiH4 and SiH3 (separated by 5 Å) transferring a hydrogen from the SiH4 to the SiH3 so that
the end product is SiH3 plus SiH4. The entire system remains frozen during this transfer, with the
hydrogen placed at different points between the two Si atoms. The Si-H interaction is completely
negligible once the distance is more than 3.4 Å (i.e. the charge density between the two is zero, and
the energy does not change once this distance is increased, hence the cutoff mentioned above). An
additional constraint upon the fitting was that the equilibrium curvature of the binding energy curve
should remain the same, so as not to disturb the vibrational modes already fitted. As it turned out, the
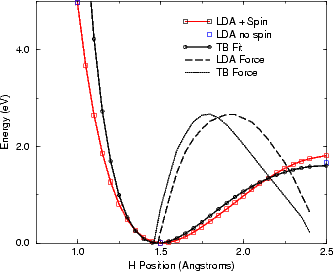
parameters as already fitted gave a good fit to the ab initio energies, as shown in Figure 3.9. The
forces from LDA and the tight binding fit are also shown in this figure, and are in remarkably good
agreement.
As will be discussed in detail in Chapter 6, there is one remaining problem with the modelling of diffusion on
the surface. When there is a long, weak bond, there is little charge density between the two atoms (e.g. between a
hydrogen and the atom towards which it is diffusing), which means that physically, there is little interaction.
Unfortunately, in tight binding, the repulsive term is sufficiently large that, rather than a weak attraction between
the atoms, there is a weak repulsion. This means that the barriers calculated by tight binding are rather high;
however, they should all suffer from about the same effect, meaning that comparisons between different barriers in
different environments should be accurate. An estimate of the effect of the repulsion is mentioned in
Chapter 6.
The parameterisations have been tested on a number of different systems, and perform extremely well. The
asymmetric bending mode of the silane molecule is modelled as 108 meV, where experimentally it should be 113
meV. The four lowest eigenvalues and stretching modes for disilane are given in table 3.5, and the bond lengths and
angles for disilane and disilene are given in table 3.6. These results indicate that the parameterisation is extremely
good for Si-H bonds in a range of environments; along with the parameterisation for C-H bonds by Horsfield et
al. (1996), it indicates that tight binding can achieve remarkable results given a relatively low level of
computational effort.
|
|
| | Eigenvalue | TB | Expt |
|
|
| | One | -16.6 | -17.3 |
| Two | -13.1 | -13.3 |
| Three | -12.1 | -12.1 |
| Four | -10.5 | -10.7 |
|
|
|
|
|
| | Vibrational mode | TB | Expt |
|
|
| | Symm Stretch | 286 | 265 |
| Symm Bend | 114 | 112 |
| Asymm Bend | 107 | 105 |
| Wag | 74 | 78 |
| Twist | 55 | 62 |
| Si-Si | 56 | 54 |
|
|
| | |
| Table 3.5: | Eigenvalues and stretching modes for the disilane molecule, from tight binding and experiment.
Eigenvalues are in eV, stretching modes in meV. |
|
|
|
|
|
| | Molecule | Si-H | Si-Si | H-Si-H | H-Si-Si |
|
|
|
|
| | Disilane | 1.48 (1.49) | 2.32 (2.33) | 109.7 (108.6) | 109.2 |
| Disilene | 1.48 (1.49) | 2.25 (2.22) | 110.7 (110) | 116.3 |
|
|
|
|
| | |
| Table 3.6: | The bond lengths and angles for disilane (Si2H6) and disilene (Si2H4). Experimental values are
given in brackets. Lengths are in Ångströms, angles in degrees. |
|
The above calculations of molecules show remarkable agreement with experiment, but do not tackle a large
system with a surface. Three of these are offered as tests of the parameterisation. First, the single missing dimer
defect of Chapter 4. The LDA results give the rebonded defect to be 0.42 eV more stable than the unbonded; this
parameterisation gives it as 0.45 eV more stable. Secondly, the SiH2 fragments of Chapter 7 are correctly ordered in
stability by this parameterisation, except for the on-dimer fragment (which, with a 60o bond angle, is a difficult
system for tight binding to model). Thirdly, the stability of Si ad-dimers in different adsorption sites on the
Si(001) surface is correctly ordered by this parameterisation. There are two positions in which the
dimer can sit (on the dimer row or over the trench; these are explained in more detail in Chapter 7)
and two orientations for each: epitaxial (perpendicular to the substrate dimers) and non-epitaxial
(parallel to the substrate dimers). The trench dimers are less stable than the row dimers, and the
non-epitaxial orientation is more stable than the epitaxial one. The parameterisation correctly predicts
these facts, though the trench dimers are more stable than they should be according to LDA; this is
again a feature of the 60o bond angles formed in these structures, which are too far from what was
fitted to be modelled accurately. So with the exception of structures with approximately 60o bond
angles, the parameterisation is extremely good for the Si(001) surface, and its interactions with Si and
H.
The creation of a silicon-bismuth and bismuth-bismuth parameterisation presented a number of challenges: Bi is
sufficiently large that the valence electrons achieve speeds through the core which make relativistic corrections
necessary; there is no AB Si-Bi compound, making the fitting of electronic parameters to an experimental
bandstructure impossible; and Bi in its native state is a semimetal in an arsenic-like structure, with puckered
graphitic sheets which are stacked sufficiently close together that the coordination is almost 6-fold (which means
that fitting to a tetrahedral bonding environment is hard).
Accordingly, the parameterisation has been put together from a number of different sources. The effect on the Es
and Ep levels of relativistic corrections have been taken from a full, relativistic solution of the Dirac equation for the
Bi atom, using Hideaki Fujitani’s ATMDAT program. The offset of the Bi Es level from the Si Es level was taken
from the same program. The pre-relativistic levels were taken from Harrison (1980), as were the hopping
parameters.
|
|
|
|
|
|
| | ES | EP | hss | hsp | hpp | hpp | 0 |
|
|
|
|
|
|
| | -15.3 | -5.87 | -1.684 | 2.213 | 3.897 | -0.974 | 5.15855 |
|
|
|
|
|
|
| | |
|
|
|
|
|
|
| | r0 | rc | dc | n | nc | m | mc |
|
|
|
|
|
|
| | 3.09 | 0.0000 | 0.0000 | 3.7847 | 0.0000 | 5.5413 | 0.000 |
|
|
|
|
|
|
| | |
| Table 3.7: | The parameters for Bi-Bi interactions. |
|
The scaling for the Bi-Bi bonds and the Si-Bi bonds is again hard to fit. An initial estimate of the Bi-Bi bond
length in tetrahedral form was made by assuming that the ratio of bond lengths for Bi in fcc and
diamond was the same as for silicon; this ratio was then applied to the Bi bulk bond length, and taken
as the diamond bond length. The Si-Bi bond length was taken as the geometric mean of Si-Si and
Bi-Bi.
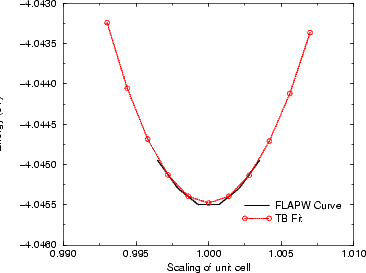
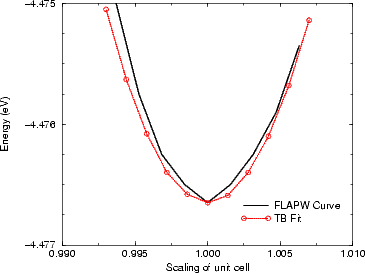
However, this is extremely crude, and a better fit was constructed. Binding energy curves for Bi in tetrahedral
form and zincblende SiBi were calculated using Hideaki Fujitani’s FLAPW code, and the tight binding scaling
parameters and repulsive potentials were fitted to these. The fits are shown in Figures 3.10 and 3.12. The most
interesting feature of this fitting is that the bond lengths derived from the FLAPW calculations were very much
larger than those predicted from the simple prescription given above (3.09 Å rather than 2.52 Å). The reason for
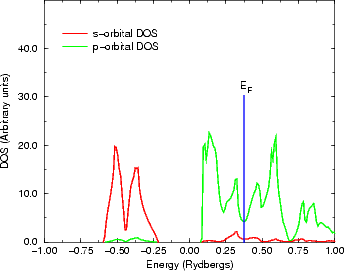
this can be seen in Figure 3.11, where the s-band is clearly about 10 eV below the Fermi level, and is thus forming a
filled, stable lone pair state, and making Bi fundamentally p-valent; thus the tetrahedral bonding
environment will be much much worse, relatively speaking, for Bi than fcc would be for Si, making
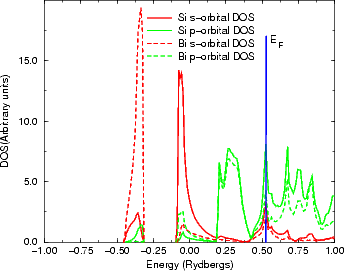
the bond lengths longer than anticipated. A similar effect, though far smaller, can be seen in Figure
3.13.
|
|
|
| | hss | hsp | hpp | hpp |
|
|
|
| | -1.802 | 2.367 | 4.169 | -1.042 |
|
|
|
| | |
|
|
|
|
|
|
|
| | r0 | rc | dc | n | nc | m | mc | 0 |
|
|
|
|
|
|
|
| | 2.75 | 0.0000 | 0.0000 | 2.7673 | 0.0000 | 4.2876 | 0.0000 | 6.0138 |
|
|
|
|
|
|
|
| | |
| Table 3.8: | The parameters for the Si-Bi interaction. |
|
The Bi-Bi bonding in the tetrahedral structure cannot really be tested, except through comparison of energies
with experiment; however, the robustness and transferability can be investigated by modelling the native bismuth
structure, or at least a puckered sheet of bismuth, which it extremely close to the native structure. The
simulation yielded a cell with nearest neighbour spacing of 3.09 (compared to 3.10 in reality) and
puckering angles of 100o, compared to 90o in reality. It seems that the Bi-Bi bonding is remarkably well
described.
The Si-Bi bonding is not so easy. There is no AB alloy, and we will have to trust that the fitting performed is
adequate. There are good reasons to assume this: the fitting procedure followed is very similar to others followed in
this thesis and elsewhere, which have produced good results; the Harrison scheme, which was used for the Es and Ep
levels of bismuth, is extremely successful for semiconductors; and the results (presented in Chapter 5) are very
sensible, with Bi taking up tetrahedral bonding positions, and allow a clear understanding of a physical problem to
be developed.
Conclusions In this chapter, the issues of which linear scaling method to use for modelling semiconductors and
how to fit parameterisations for tight binding have been addressed. The Density Matrix method has been found
conclusively to be the best method for modelling semiconductors, particularly when there are narrow features in the
density of states. Parameterisations for Si-Si, Si-H and Si-Bi bonds have been described, along with the fitting
procedures. Those tests available (which are far more numerous for Si-Si and Si-H than for Si-Bi) suggest that the
parameterisations are extremely good.
![[ V~ ------------------]
sb = 1 (ESi + EH )- (ESi- EH )2 + 16h2 (3.4)
2 s s s s sss
[ V~ -------------------]
1 ( Si H ) ( Si H)2 16 2
tb = 2 E p + Es - Ep - E s + 3 hsps (3.5)
[( ) V~ (--------)---------]
ta = 1 ESip + EHs + ESpi- EHs 2 + 16h2sps (3.6)
2 3
[ V~ ------------------]
s = 1 (ESi + EH )+ (ESi- EH )2 + 16h2 (3.7)
a 2 s s s s sss](Master106x.gif)