... A molecular system ... (passes) ... from one state of equilibrium to another ... by means of all possible
intermediate paths, but the path most economical of energy will be the more often traveled.
Henry Eyring, 1945
Hydrogen is an interesting system to study for two main reasons: firstly, it is a prototypical system for diffusion,
which is easy to image in STM, and is therefore good to model, as there is comparative data available; secondly, it
plays an important role in the growth of silicon from disilane, as described in Chapter 7. At low temperatures, the
silicon growth rate is limited by the hydrogen desorption rate (Mokler et al. 1993 and Wu and Nix 1994) since the
adsorbed hydrogen can block incoming disilane molecules or fragments, although growth can proceed
slowly on a hydrogen saturated surface (Boland 1991a). It can also influence the rate of diffusion of Si
atoms (Eaglesham et al. 1993, Vasek et al. 1995), which then affects the morphology and the rate of
growth.
Hydrogen adsorbs on the surface of silicon by breaking the  -bond of the silicon dimer (Wu and Carter 1991) and
bonding to one of the dangling bonds thus created. The remaining half-filled dangling bond appears as a bright blob
in the STM, while the hydrogen at the other end is relatively dark (Boland 1991b), due to the bonding energy gain.
Hydrogen adsorbs randomly at coverages of less than 0.1ML (Boland 1992,1993), but after that it pairs up onto a
single dimer (Widdra et al. 1995). This arrangement, with one hydrogen on each end of a silicon dimer, is the most
stable phase for adsorption, as the silicon atoms are both four coordinate, with no dangling bonds. Widdra et
al. found that this pairing occurs at adsorption temperatures between 150K and 600K, and that the amount of
pairing was independent of temperature; they proposed a mobile precursor mechanism (similar to that proposed
by Sinniah et al. (1989) for desorption) to explain this. In this mechanism, the incoming hydrogen
atom is in an excited, band state with a finite lifetime, which will sample several different adsorption
sites. If the lifetime allows it to sample, say, 10 sites, then for coverages below 0.1 ML, the hydrogen
distribution will appear random, and above that it will be almost entirely paired. Confirming that
the diffusion barrier is sufficiently high to prevent diffusion on adsorption over a good part of the
temperature range used (150-600 K) would lend weight to this argument. These two experiments suggest
that the diffusion barrier is sufficiently high to prevent diffusion upon adsorption; this is the only
experimental evidence available on diffusion apart from the work connected with this thesis (Owen et
al. 1996).
-bond of the silicon dimer (Wu and Carter 1991) and
bonding to one of the dangling bonds thus created. The remaining half-filled dangling bond appears as a bright blob
in the STM, while the hydrogen at the other end is relatively dark (Boland 1991b), due to the bonding energy gain.
Hydrogen adsorbs randomly at coverages of less than 0.1ML (Boland 1992,1993), but after that it pairs up onto a
single dimer (Widdra et al. 1995). This arrangement, with one hydrogen on each end of a silicon dimer, is the most
stable phase for adsorption, as the silicon atoms are both four coordinate, with no dangling bonds. Widdra et
al. found that this pairing occurs at adsorption temperatures between 150K and 600K, and that the amount of
pairing was independent of temperature; they proposed a mobile precursor mechanism (similar to that proposed
by Sinniah et al. (1989) for desorption) to explain this. In this mechanism, the incoming hydrogen
atom is in an excited, band state with a finite lifetime, which will sample several different adsorption
sites. If the lifetime allows it to sample, say, 10 sites, then for coverages below 0.1 ML, the hydrogen
distribution will appear random, and above that it will be almost entirely paired. Confirming that
the diffusion barrier is sufficiently high to prevent diffusion on adsorption over a good part of the
temperature range used (150-600 K) would lend weight to this argument. These two experiments suggest
that the diffusion barrier is sufficiently high to prevent diffusion upon adsorption; this is the only
experimental evidence available on diffusion apart from the work connected with this thesis (Owen et
al. 1996).
There have been many theoretical investigations of hydrogen diffusion on Si(001), though none of them have
been conclusive. Wu and Carter have performed many cluster calculations using CI techniques and initially
(Wu and Carter 1992) predicted diffusion barriers of 2.0 eV along the dimer rows and 2.7 eV across
the dimer rows. However, they used a small cluster consisting of 9 silicon atoms terminated with 12
“pseudo-hydrogen atoms”, and did not allow the substrate to relax during diffusion, which suggests that their
barrier will give a poor answer to the actual barrier. The CI method finds a very accurate answer,
but the degree of relevance of the answer found to the physical system is rather small, due to the
use of clusters. When they later performed different calculations (Wu, Ionova and Carter 1994) using
empirical potentials (based on the Stillinger-Weber potential) which they had generated from SCF-LCAO
calculations, and allowed the slab substrate to relax, they found a significantly lowered barrier of 1.5 eV
for diffusion along the dimer row and a slightly lowered value of 2.5 eV for diffusion across dimer
rows.
This lower barrier fits with calculations by Vittadini, Selloni and Casarin (1993) who found a barrier of 1.3 eV,
though I would argue that using empirical potentials to model a process where the bond breaking is vital, as Wu,
Ionova and Carter did, will only get results by luck. Vittadini, Selloni and Casarin used LDA, and a repeated slab
for their calculations, and allowed the top four layers of the slab to relax. They claim that the major
difference between their calculations and those of Wu and Carter (1992) is the lack of surface relaxation in
Wu and Carter. They attempt to estimate the magnitude of this effect by performing their diffusion
calculations without allowing the substrate to relax, and conclude that the effect can be as large as 1
eV.
All of these sources of evidence indicate that the diffusion of hydrogen on Si(001) has an activation barrier of at
least 1.3 eV, and that hydrogen is unlikely to hop across the dimer rows (as hopping across dimer rows is likely to
occur in a similar temperature regime as desorption).
It is worth discussing briefly here the effect of the zero-point energy of hydrogen on diffusion barriers. If we
assume that the dominant mode which is contributing to this is the Si-H bond stretch, which has a value of about
2100 cm-1, then the zero-point energy (using the standard form of  h
h ) is about 0.04 eV for each of the three
directions. This might double at the mid-point (but is unlikely to increase any more), leading to a change of up to
0.04 eV. Such a value fits well with the expectation found from EELS data that the change in zero-point energy for
hydrogen even for heavy structural modifications varies by less than 3 % (Stucki et al. 1983). Thus it will be a
relatively minor change.
) is about 0.04 eV for each of the three
directions. This might double at the mid-point (but is unlikely to increase any more), leading to a change of up to
0.04 eV. Such a value fits well with the expectation found from EELS data that the change in zero-point energy for
hydrogen even for heavy structural modifications varies by less than 3 % (Stucki et al. 1983). Thus it will be a
relatively minor change.
While it seems a little unusual to be describing the experimental work in detail in a thesis which is primarily
theoretical, the modelling does interact with the experiment, and the results are so elegant that they deserve
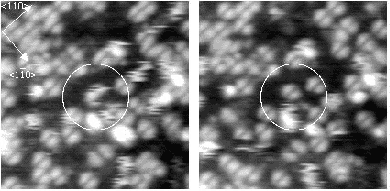
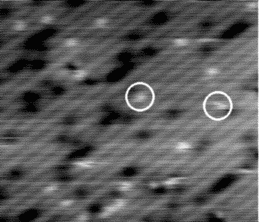
repetition. Images obtained at up to 500 K show small white dots (which are the result of hydrogen adsorption, and
are the dangling bond at the unhydrogenated end of the dimer) which do not move over periods of up to 15 minutes
(a pair of images 15 minutes apart are shown in Figure 6.1). The means that the maximum hopping rate of the
hydrogen is once every fifteen minutes.
Once the sample is warmed to about 600 K, the hydrogen starts to move between pictures. Figure 6.2 shows two
pictures taken at 600 K, separated by 10 seconds. The dots are moving, and appear to be slightly
fuzzy, when compared to the previous, lower temperature pictures. This change in appearance will be
discussed below. This temperature gives two limits on the hopping rate: the minimum hopping rate is
once every ten seconds, and the maximum is the scan rate of the tip, which is once every 1/50th of a
second.
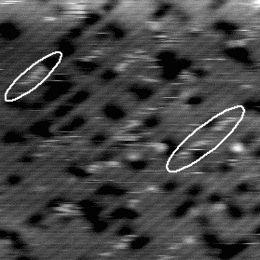
If the sample is warmed further, the hydrogen starts to move on the timescale of the tip scan. An example of the
behaviour at 640 K is shown in Figure 6.3. The STM tip scans down the image in a series of 512 line scans. On
reasonably high resolution, each dimer will be broken down into between 3 and 5 lines - i.e., the STM tip samples
each dimer 3-5 times. Once the hydrogen is hopping once every 1/50th of a second, it can move off any given dimer
onto another in the time that the tip makes a single line scan. This means that on any given dimer, out of the
4 linescans in which it is sampled by the tip, it may be occupied, unoccupied, occupied and finally
unoccupied, or any other combination; more to the point, it will appear on several dimers in this fashion,
elongating its normal appearance. This will lead to the smudged appearance which has been circled in
Fig. 6.3, and gives a minimum hopping rate, as we know that it is hopping faster than the tip can
scan.
The imaging of a moving hydrogen atom by a scanning tip is an interesting problem; a phenomenological model
was created to study this. As explained above, each dimer is scanned about four times in the course of the STM
scanning down the selected area. In the model, the hydrogen started at a random site, and was given a certain
probability of hopping each time the tip scanned (e.g. every 1/50th of a second). The length of available dimer row
(e.g. 10 dimers, which represents the relatively high defect density on the surface, and an assumption that the
hydrogen cannot hop over a defect which is justified later in this chapter) was fixed, and a given number of smudges
for those initial conditions generated. A set of 10 smudges is given below for 10 dimers, with 4 line scans per dimer
and a hopping probability of 0.2 per line scan; a 1 represents conjunction of the STM tip and the H, while
a 0 represents no such conjunction. Each result is broken up into units of four, each representing a
dimer.
Smudge 1: 1000 0001 0000 1001 1001 1011 1110 0010 0000 1111
Smudge 2: 0000 0000 0000 1111 0000 0010 0000 0000 0000 0000
Smudge 3: 0000 0001 0010 0000 0000 0000 0000 0011 1000 0000
Smudge 4: 0011 0000 0000 0000 0000 0000 0000 0000 0000 0000
Smudge 5: 0000 1100 0000 0000 0000 0000 0010 0000 0000 0000
Smudge 6: 0000 0000 0000 0000 0000 0000 0000 0001 0000 1100
Smudge 7: 0000 0000 0000 1001 0000 0000 0000 0000 0000 0000
Smudge 8: 1111 1000 0000 0000 0000 0110 0000 0000 0000 0000
Smudge 9: 1111 1101 0000 0000 1111 0110 0000 0000 0010 0111
Smudge 10: 0000 0000 0000 0000 0000 0000 0000 0000 1100 0000
|
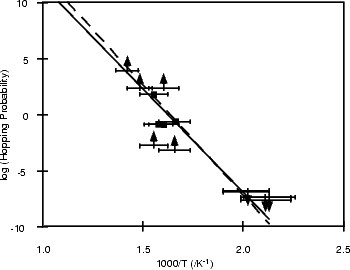
From this kind of model, and the statistics generated by longer runs similar to the above, it was found that the
hydrogen starts to smudge with a hopping probability of about 0.2 per line scan. The onset of smudging is seen as a
slight fuzziness of the hydrogens, as seen in Fig. 6.2. This value of 0.2 has been used, appropriately modified to
reflect a hopping rate, as a measured hopping rate in the plot shown in Figure 6.4, and is labelled
with squares. The overall set of results is shown in Figure 6.4, as a plot of hopping rate against 1/T.
The Arrhenius plot assumes that the hopping probability, h, depends on an attempt frequency, A,
and the barrier Eb, in the following manner: h = Ae-Eb/kT. The attempt frequency can critically
affect the barrier height calculated from the plot; a value of 1013 s-1 is a reasonable figure from the
literature for the Si-H bond vibration, and yields a barrier height of 1.68 eV. This is shown as a solid line
in Fig. 6.4. The maxima given by the low temperature data (labelled with arrows pointing down),
and the minima given by the high temperature data (labelled with arrows pointing up), indicate that
this value of 1013 s-1 is a minimum. A fit with an attempt frequency of 1014 s-1 is shown with a
dashed line in Fig. 6.4. This gives a barrier height of 1.8 eV; it is important to stress that both of these
barriers are within experimental errors. The whole procedure is discussed in more detail by Owen et
al. (1996).
This problem has been approached from two directions: that of LDA and GGA, and that of tight binding. The
former have been used for this problem essentially to validate the tight binding calculations, and for comparison
with experiment; once the tight binding parameters have been validated, larger systems than can be tackled
with LDA may be addressed, such as steps and defects. These will be described in Sections 6.4 and
6.5.
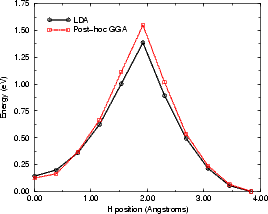
The hydrogen diffusion was modelled using LDA to obtain coordinates and charge densities, and both LDA and post
hoc GGA to obtain the energies, using the standard unit cell. The hydrogen atom which was to diffuse was placed
on one end of a dimer in one row, and to prevent the system from having an unfilled band, a hydrogen atom was
also placed on the other side of the other dimer row. This hydrogen atom played no part in the diffusion (except
to obviate the need for a subspace rotation at every step to correctly half-fill one band). The only
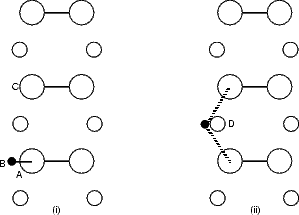
constraint applied to the system was to force the hydrogen atom to remain in a plane of constant y (in
Figure 6.5(b), the y axis runs vertically up the page), which was moved along the dimer row at each
point in the calculation. The energies from both LDA and GGA calculations are shown in Figure
6.5(a).
The mid-point ((ii) in Fig. 6.5(b)) is highly unstable, as shown by the sharp peak in the graph. This
is not unreasonable, as the hydrogen is bonded to two silicon atoms at this point, which is not an
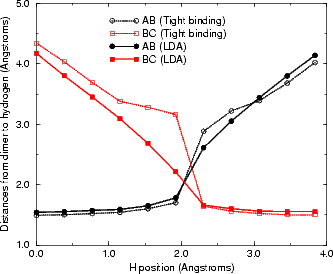
energetically favourable state for a 1s1 atom to be in. The distances between the hydrogen and the two
silicon atoms are shown in the next section, in Fig. 6.7; these show that once the hydrogen is past the
mid-point it bonds strongly to the atom towards which it has been diffusing, and less strongly to
the atom on which it started. The energies obtained (1.55 eV from GGA and 1.39 eV from LDA)
are a little smaller than the experimental number (1.68 eV), but bring home the point that gradient
corrections can be important in obtaining the correct value of barrier heights, for the GGA result
agrees to within experimental error. The barrier is increased to 1.6 eV with the addition of spin to the
calculation, which brings the calculated value well within experimental errors. Another point worth
raising here is that of attempt frequencies: the experimental number of 1.68 eV was found from hopping
rates and assuming an attempt frequency of 1013 s-1, while another frequency which fits perfectly
well (1014 s-1) gives a barrier of 1.80 eV. It is certainly accepted that LDA cannot predict attempt
frequencies accurately (Smith and Jónsson (1996) state that a factor of 5 is too sensitive for LDA to
correctly model; see Blöchl, van de Walle and Pantelides (1990)), and so it has been decided that
the prefactor relevant for comparing LDA/GGA hopping rates should be taken as 1013 s-1. This fits
well with values from the literature found using, for example, experimental vibrational mode studies.
This is the first ab initio study of this system to predict a barrier which agrees with the experimental
value.
To calculate the energy of a hydrogen atom diffusing on the Si(001) surface using tight binding is a difficult task.
Particularly, the bonding at the saddle point will be highly non-equilibrium and therefore test the
fitting of the parameterisation enormously. The fitting employed in the parameterisation developed
during this work has been described in Chapter 3; here I will describe the application to a problem of
diffusion.
The standard unit cell was used for this calculation. The only constraint applied to the system was the same as
for the LDA modelling, i.e. constraining the hydrogen to lie in planes of constant y. The hydrogen was only allowed
to bond to two silicon atoms - the one it starts on and the one it ends on. The other atom to which it could bond is
the second layer atom to which the two dimers are bonded (marked as ‘D’ in Fig. 6.5(b)). Tests showed that if this
atom was allowed to bond to the hydrogen, the bond energy was almost zero, but the repulsive energy was high;
this was clearly unphysical and solved by removing the interaction. Examining surfaces of constant
charge density from the LDA calculations showed that there was almost no charge between these two
atoms, indicating that any interaction is negligible and that the above approximation is good. The
start and end points are not exactly symmetrical, as the cell is p(2x2), but the energy difference is
small.
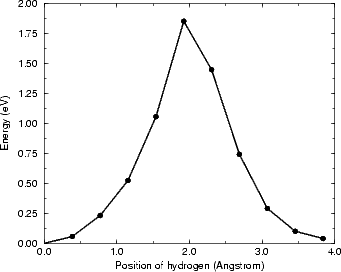
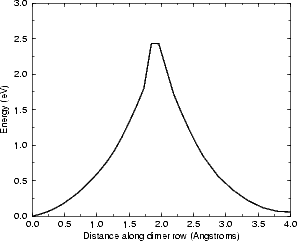
The energy for the diffusion reaction is shown in Figure 6.6, and the bond lengths between the hydrogen and the
two atoms to which it bonds are shown, along with the equivalent LDA lengths, in Figure 6.7. This latter figure
displays the biggest problem which tight binding has: when the hydrogen is just within bonding range of the second
dimer, instead of a slight attractive interaction (as seen in LDA) there is a slight repulsive one (shown by the knee
in the TB curve, and caused by the same effect as that alluded to above for the second layer Si atom - a high
repulsive term where there is a low electron density). This is due to the fact that TB cannot take into account
screening - the physical interactions represented by the TB repulsive term are very small, but this
is not reflected in the relatively large repulsive interaction. The error induced by the repulsion has
been estimated as 0.2 eV; this was found by taking the unit cell at the mid-point, and comparing the
energy for the cell both as it is and after re-relaxing without the interaction between the hydrogen
and the second atom (C). This makes the overall barrier 1.76 eV (with an error of up to ± 0.15 eV),
which is much more in line with experiment. This correction will be applied throughout the thesis
where hydrogen diffusion processes are modelled. More importantly, however, it should be noted that
this anomalous repulsive interaction will be reasonably independent of whatever diffusion process is
being modelled, and that energy differences between processes will reflect reality extremely accurately.
This will be important in the remaining sections of this chapter. It is extremely encouraging that,
with the correction applied, TB predicts a barrier in good agreement with experimental and LDA
results.
It has been shown above that the diffusion of single hydrogen atoms on a clean silicon (001) surface can be
understood both by experiment and theory; however, the growing surface is likely to be saturated with hydrogen,
and it is necessary to understand diffusion in this situation as well. As mentioned in the introduction to this
chapter, it is energetically favourable for two hydrogen atoms to adsorb on the same dimer on the silicon surface,
and once there is more than about 0.2 ML of hydrogen, this occurs. Once the coverage reaches 0.8 ML or above,
most of the surface will be covered with paired hydrogens, and it becomes helpful to think of the clean dimers as the
minority species. While these dimers do not migrate as such, the effect of two hydrogens moving in one direction
will be to produce a vacancy moving in the other. It is particularly easy to image these vacancies in
STM in empty states, as the * orbital stands out; it is a beautiful image of an anti-bonding orbital,
which has a node in its middle. An example of the hydrogen saturated surface is shown in Figure
6.8.
The saturated surface does not start to show any signs of movement until 600 K, at which point changes occur
on the timescale of minutes, and changes between sequential images are not visible until 650 K (as
compared to the clean surface with single hydrogens where changes between sequential images were
visible at 600 K). Once movement occurs, it occurs in pairs. That is, the * orbitals appear to move,
which is actually caused by pairs of hydrogen moving. The tight binding parameterisation described in
Chapter 3 and validated above in Section 6.3.2 has been used to investigate the cause of the barrier for
paired diffusion being higher than for single atom diffusion, and the mechanism underlying paired
diffusion.
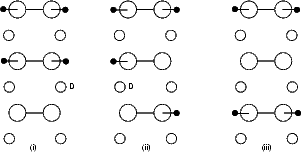
The standard unit cell was used, with five of the dimers saturated with hydrogen, and one dimer clean. There are
two obvious ways for the pairs of hydrogen to move: in a concerted motion, with both moving simultaneously; and
for one to diffuse, creating two single hydrogens briefly, and for the second then to follow (or, equivalently, for the
first to return). Both of these possibilities were modelled, applying different constraints. For the concerted motion,
both atoms were forced to remain in the same plane of constant y, which was moved along the dimer row at each
point in the calculation. In Figure 6.9(b), the y axis lies vertically up the page. For the separate motion, the first of
the diffusing atoms was constrained to lie in a plane of constant y, while the second was left free; once the
first atom had moved to the new dimer, the same process was applied to the second atom. As was
true for single hydrogen diffusion, the second layer atoms labelled ‘D’ were not allowed to bond to
the hydrogen. The results are shown in Figures 6.9 and 6.10 for the separate and concerted motions
respectively.
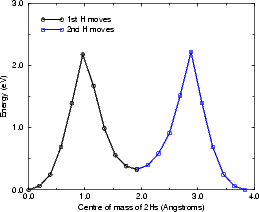
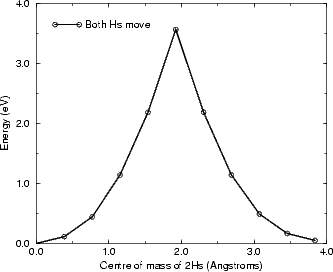
As can be seen, while the energy barrier for the concerted motion (Fig. 6.10) is less than twice the energy for a
single hydrogen diffusing, it is still 3.6 eV, which is far too high for any diffusion to occur, even at 650K (even
applying the correction mentioned above yields a barrier of 3.2 eV). The separate case (Fig. 6.9) is more interesting.
The initial barrier of 2.18 eV (1.98 eV corrected) is higher than that found for the clean surface (1.96 eV or 1.76 eV
corrected), but the barrier for the second hydrogen to diffuse is significantly lower than the initial barrier
(1.89 eV or 1.69 eV corrected). The corrected barrier for the first atom to diffuse (1.98 eV) matches
extremely well with the experimental value of 1.95 ± 0.2 eV (Owen, Bowler, Miki and Briggs 1997)
and 1.69 eV for the second hydrogen means that the second diffusion event will occur extremely fast
at 600 or 650 K. This makes the diffusion mechanism clear: the rate-limiting step is the breaking
up of the paired hydrogen, which is then followed extremely quickly by the repairing, with a 50%
probability of reforming without having moved. This means that at 600K, the second hydrogen is about 300
times more likely to diffuse than the first, and at 700K it is about 150 times more likely. So, at an
experimental temperature at which the vacancies are observed to be hopping once every 10 seconds or so (i.e.
once per image on average) the mean hopping time for the first atom will be 10 seconds, while for
the second atom it will be 1/20th of a second. This leads to the appearance of concerted motion in
STM.
This investigation is a clear case of where the experimental/theoretical interaction is so vital: without the
experimental images of the vacancies moving, the question to address would have been unclear; without the
theoretical modelling, however, the mechanism could not have been elucidated. This is one way in which the
collaboration proceeded: experiment finds an interesting, but inexplicable, phenomenon, and theory is guided to the
explanation.
As has already been discussed in Chapter 4, the bonding at steps and defects is different to that on the perfect
surface. It is important to understand how this affects both diffusion and stability, as these will have a strong
influence on growth if different.
The question of growth of silicon will be covered in more detail than it is here in Chapter 7; however, it is worth
discussing the question of denuded zones and steps here. In solid-source MBE, large areas of clean terrace are seen
both above and below B-type steps on the growing surface - there are no islands and very few atoms in these areas.
The explanation for this is that the B-type step is a nucleation site for growth, and all atoms which are within a
certain distance of the step bond there, resulting in step-flow growth and double steps, eventually. In the gas
source growth experiments performed, however, (Owen et al. 1997a,b) none of these denuded zones
were found below 700K, and islands nucleated close to the step edge. The only explanation available
for this is that the rebonded edges of the step are being saturated with hydrogen, which is stopping
growth.
To determine whether this is correct, two questions must be answered: is the step a good site for hydrogen to
adsorb at, and how does it get onto the step edge ? The first question can be answered by finding the energies
for adsorbing hydrogen at different step edges in different configurations; these are given in Table
6.1 from TB calculations, which used a unit cell fourteen dimers long and two dimer rows wide. The
hydrogens at the top of the step are adsorbed on the dimer at the edge, while the hydrogens at the bottom
are adsorbed on the three-coordinate second-layer atoms. See Fig. 4.8 for a diagram of the B-type
step. The energies are given for pairs of hydrogen, as this is the configuration found on the growing
surface.
|
|
|
|
| | System | Saturated Bottom | Saturated Top | Isolated Pair |
|
|
|
|
| | Clean | -5.98 | -5.98 | -5.98 |
| Rebonded | -6.16 | -5.92 | -6.11 |
| Unbonded | -5.78 | -5.56 | -5.76 |
|
|
|
|
| | |
| Table 6.1: | The energy for adsorbing pairs of hydrogens on a clean surface, and at a B-type step (both
rebonded and unbonded) from TB. All energies are in eV. “Saturated” refers to complete coverage of the
step; “Isolated” means that there is at least one clean dimer row between neighbouring sites. |
|
These data reveal a variety of results: there is little interaction between dimer rows (compare the columns
Saturated Bottom and Isolated Pair); the top of a step is less stable for a pair than the clean surface; the rebonded
step is a significantly better site for a pair of hydrogens than the clean surface, whereas the unbonded
step is a poor site. This implies that, if it can get there, hydrogen will stick onto a rebonded B-type
step.
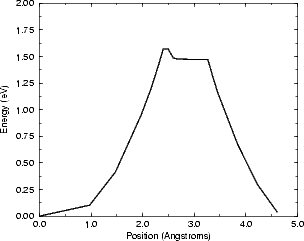
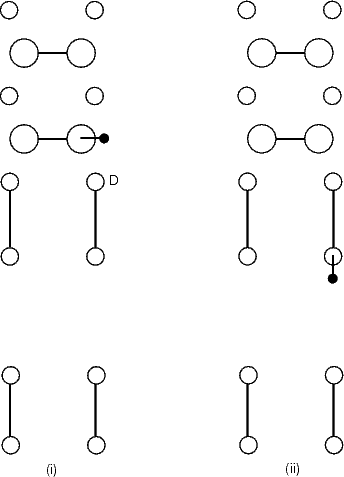
The most obvious manner for a hydrogen to get onto a rebonded B-type step is by diffusion down from the
terrace above; diffusion along the step will be blocked by any other hydrogen already present, and may well have
a higher barrier due to a more stable start point (by analogy with the saturated surface diffusion).
The diffusion from the top of the step onto the base has been modelled with TB, and the results are
presented in Figure 6.11(a) below, along with a schematic diagram showing the process in Fig. 6.11(b). As
with all processes modelled in this chapter, the atom labelled ‘D’ was not allowed to bond to the
hydrogen.
The diffusion was modelled using TB with a unit cell in which there were 5 dimers in the upper terrace, and the
equivalent of 5 in the lower (as discussed in Chapter 4, this is the smallest unit cell for a rebonded step which has
no clear interactions between steps), with the bottom layers of the cell terminated in hydrogen and
frozen in bulk-like positions in the usual manner. The diffusing hydrogen was constrained in planes of
constant y (lying along the dimer row in the upper terrace - the y axis runs vertically up the page in Fig.
6.11(b)), and only permitted to bond to the atoms it starts and finishes on - specifically not to atom D.
The barrier found is 1.57 eV, which is reduced to 1.37 eV taking into account the correction. This
is 0.4 eV lower than the barrier on the clean surface, and means that by the time the hydrogen is
diffusing on the clean surface, it will diffuse extremely fast down the steps (3000 times as fast as on
the clean surface at 600K). The plateau just to the right of the peak is an unusual feature, and is
caused by the geometry of the system. Whereas for diffusion on the clean surface the mid-point is
unstable, and the hydrogen is only bonded to one atom either side of the peak, the step geometry allows
the hydrogen to remain bonded to both atoms by increasing its height at each point away from the
step edge. Eventually, the distance to the top of the step becomes too high, and the drop starts. In
the context of saturating the bottom of a step with hydrogen, it is worth noting that the barrier is
equally low for the hydrogen to climb the step as to descend it. There are, however, other factors that
will combine to maintain the saturation: the extra stability gained from pairs of hydrogens at the
bottom; and the population of hydrogen on the upper terrace - if the site at the top of the step is
occupied (as it may well be, given the amount of hydrogen on the surface), then the diffusion will not
occur.
To sum up, the evidence for hydrogenated B-type steps during growth is as follows: a pair of hydrogens is 0.2 eV
more stable at a rebonded B-type step than on a clean dimer; the barrier for diffusing down a step is
1.37 eV; hydrogenating a step does not stop enhancement in STM at low voltages (see Chapter 4);
experimental images show a lack of denuded zones. Altogether, this offers a strong case for believing
that the steps are hydrogenated, and this is what causes the edges to stop being a nucleus for dimer
growth.
While the bonding of the 1DV has been discussed in Chapter 4, and shown to be such that it is less reactive that an
equivalent dimer site, the bonding of the dimers either side of it has not been investigated. If they pin - or
alternatively repel - hydrogen, then this will have an effect on the mobility of hydrogen and hence growth. As was
the case for steps, the first test is to investigate stabilities for adsorbing hydrogen, and these are shown in Table 6.2.
These energies come from TB calculations, with a unit cell consisting of two standard unit cells side-by-side, with
one defect in the system.
|
|
|
| | Clean | Defect
|
|
|
|
| | No of Hs | Energy (eV) | No of Hs | Energy (eV) |
|
|
|
| | 0 | 0.00 | 0 | 0.00 |
| 1 | -2.56 | 1 | -2.69 |
| 2 | -5.98 | 2 | -5.98 |
| 3 | -8.53 | 3 | -8.63 |
| 4 | -11.95 | 4 | -11.92 |
|
|
|
| | |
| Table 6.2: | The energy for adsorbing hydrogen at a single missing dimer defect, compared to a clean surface. |
|
There is little conclusive to draw from these data, except, perhaps, that the defect is a sink for a single hydrogen.
This can be understood by considering the bonding: the defect is a strained bonding situation, and the energy
gained by putting a hydrogen on the dimer must be offset against the cost of flattening the dimer slightly (the angle
drops from about 15o to about 3o); this becomes exacerbated when two hydrogens are placed on the dimer, and it
must become flat. However, the energy gained by saturating the surface state means that, overall, the two situations
are equal. More information about the effect of the defect on hydrogen can be gained by considering the diffusion
away from the defect, and the energy for this calculated using TB is shown in Figure 6.12(a), along
with a schematic diagram indicating the diffusion cell modelled in (b). The unit cell used was six
dimers long and two dimer rows wide, with a defect in one of the rows. The constraint applied was, as
above, forcing the hydrogen to remain in planes of constant y, with the y axis running vertically up
the page in Fig. 6.12(b). As usual, atom D played no part in the diffusion reaction. The defect has
pulled the dimers next to it towards each other, resulting in a longer distance for the hydrogen to
diffuse.
This figure shows that the defect acts as both a sink for hydrogen atoms (for once they are adsorbed next to it,
they require a large amount of energy to get off) and also a mirror (it is as hard to get on as to get off). As with the
step, it is the bonding of the situation which is responsible for the barrier height. The dimer which the
hydrogen starts on is next to a 1DV, and is pulled away from the normal position in the surface. This
means that the distance between the dimer the hydrogen starts on and the one it is going towards is
increased - as can be seen by comparing Figs. 6.6 and 6.12. This increased distance means that at the
mid-point, the hydrogen atom has much longer bonds to both dimers, giving an increased barrier
relative to diffusion on the clean surface. The barrier is remarkably symmetrical, which implies that
the defect may well act as a mirror - any hydrogen adsorbed two dimers away from a defect will be
far more likely to diffuse away from the defect than towards it, due to the increased barrier of 0.5
eV.
This resolves a question from experiment (Owen 1996, p.72 and Fig. 4.7); there were several observations of a
smudge trapped between two defects, which then disappeared at high temperature (700 K). The only explanation
given the above result is that the hydrogen atom hopped across dimer rows (an event seen experimentally at 700 K,
though very rarely), rather than across the defect.
Conclusions The behaviour of hydrogen has been investigated, using tight binding and LDA. The diffusion on a
clean surface has been modelled, and shows good agreement with experiment; the tight binding parameterisation
has proved reliable. The mechanism for diffusion on the saturated surface has been found using experimental
results to produce a path, and theoretical modelling to explain the behaviour along this path. The
behaviour of hydrogen near steps and defects has been modelled, and an explanation provided for
the lack of denuded zones in gas source growth. The rebonded B-type step proves to be a sink for
hydrogen, while the 1DV will act as a mirror due to the high barrier for diffusion onto dimers adjacent to
it.
 th of a second.