UCL degree classification statistics
UCL has a handy publicly-accessible Student Statistics website. This post is a quick look at the content of section S “First degree awards by department.”
Data problems
The data is provided as a zip file containing a spreadsheet with one worksheet per academic year and a separate pdf for each academic year. They have breakdowns of degrees awarded by department, faculty, and degree classification, from 1995/96 to 2024/25. There are a few quirks in the data: 1996/97 is missing, the data for 2000/01 in the spreadsheet is duplicated on the 1999/00 sheet, and the 1999/00 pdf has all data except the faculty breakdown replaced by ######. Also I’m not certain the split into pass degrees and “ordinary or aegrotat” is done consistently, and the wording (and presence) of these categories varies from year to year, but the numbers are small enough that it doesn’t make a lot of difference.
Student numbers
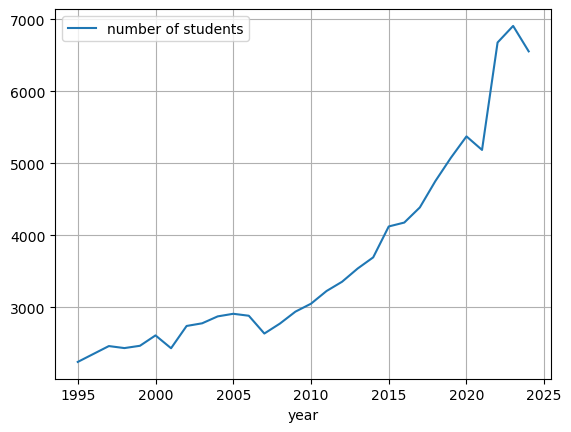
No surprises here: student numbers grew. These are the total numbers of students awarded first degrees.
The figures for maths degrees show a similar growth.
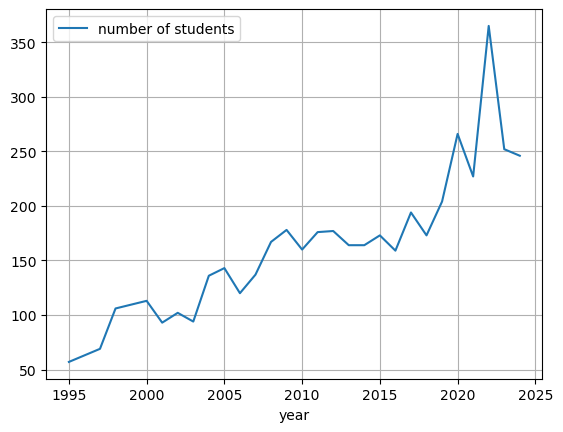
The big spikes on both plots are of course the covid years, when admissions were handled differently (e.g. the use of predicted A-level grades).
Classifications
This is the breakdown of degree classifications by year. The pass and ordinary/aegrotat lines shouldn’t be relied on, as mentioned above, and are only included to show that the numbers are tiny anyway. As before, the big spike in firsts is for UCL’s covid mitigations which led to over 70% of maths students getting a first in the peak year.
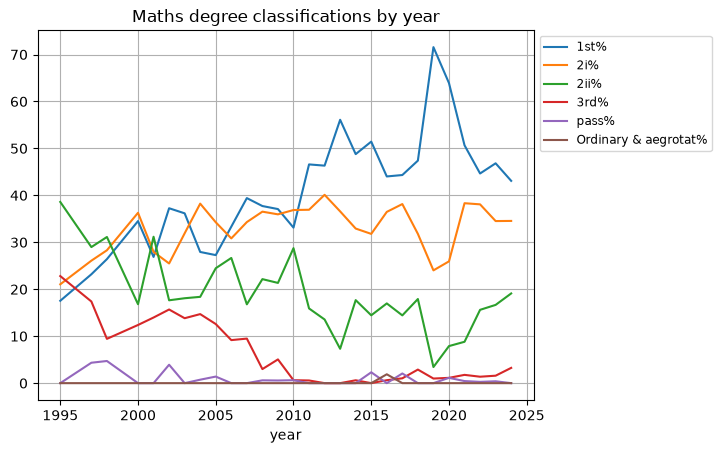
When comparing this to the overall data, it’s helpful to keep in mind the A-level maths and further maths grade breakdowns in relation to overall a-level grades, where people who do those A-levels tend to do very well.
The overall data also shows a big growth in the number of firsts. Most people get a 2i, and the number of firsts has risen very roughly by an additive increment of 1% annually, while 2iis and 3rds have declined.
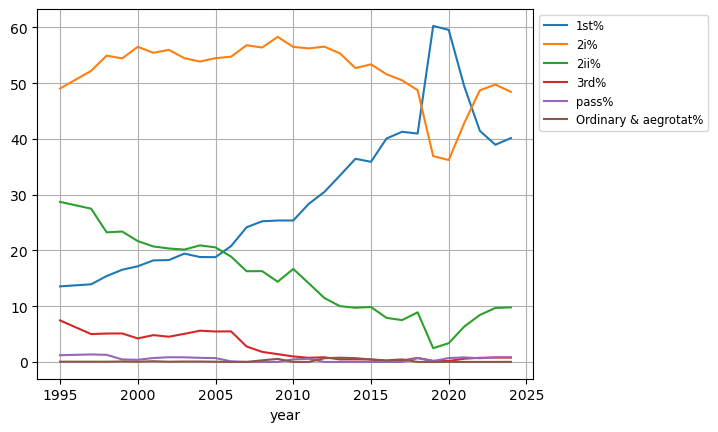
A typical (but of course not universal) complaint from academic mathematicians is that the 40-50-60-70 classification boundaries used in the UK system aren’t appropriate to the discipline, and especially that the first class boundary of 70 should be higher. Whatever you think about that, it’s orthogonal to the issue of the increase in the percentage of firsts awarded.