How Can We Know That Zebrafish Are Asleep?
Sleep is a specific behavioral state that is defined as a period of inactivity, usually associated with a specific posture or resting location, that is accompanied by a change in arousal threshold. In other words, a sleeping animal (or human) is less sensitive to environmental stimuli than when they are awake.
In addition, sleep is under both circadian and homeostatic control. That is, the timing of sleep is governed by a 24-hour rhythm, but if you deprive an animal (or human) of sleep, they will also exhibit increased sleep pressure followed by longer or deeper sleep.
Sleep Criteria
- Behavioral quiescence (reduced activity)
- Specific posture or location
- Increased arousal threshold
- Circadian regulation (24-hour rhythm)
- Homeostatic regulation (sleep pressure)
Using these criteria, the pioneering work of Irene Tobler, Joan Hendricks, Paul Shaw, and others demonstrated that even insects like the fruit fly have a sleep-like state, thus paving the way for the experimental investigation of sleep in simple model systems.
Zebrafish as a Sleep Model
Similarly, we and others have demonstrated that both adult and larval zebrafish sleep.
Using automated video-tracking software, we watch the sleep/wake behavior of hundreds of zebrafish larvae over several days and nights, up to two weeks.
Automated Video Tracking
This video shows zebrafish larvae automatically tracked in a 96-well plate. In this video, each larva's active (red) and inactive (blue) bouts are recorded. By recording the movements of each fish simultaneously, we can observe how experimental manipulations alter the larva's long-term behavioral dynamics.
Data Analysis & Behavioral Fingerprinting
Recording Sleep Patterns
The recorded activity of a single larva plotted over two days shows clear patterns of activity and rest. The gray shaded areas indicate nighttime periods.
We extract multiple parameters from each larval dataset including:
- Sleep latency (time to fall asleep)
- Number of sleep bouts
- Sleep bout length
- Total sleep time
- Activity levels during wake
- Wake bout fragmentation
Combining this data into a behavioral fingerprint allows us to make statistical comparisons between datasets and identify subtle changes in sleep architecture.
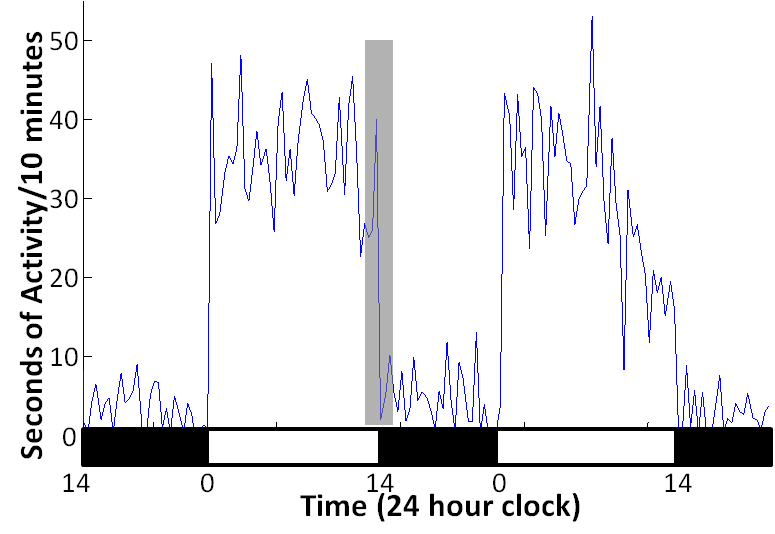
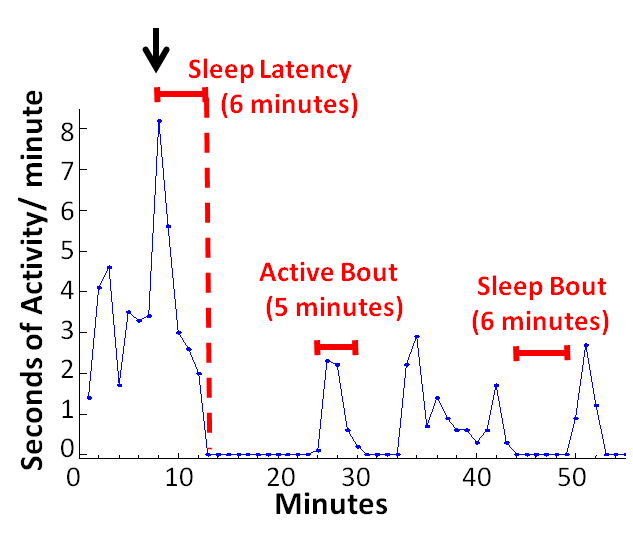
Activity trace showing sleep/wake patterns over 48 hours. The lower graph is a zoomed in view of the grey area.