
Bayesian Phylogeographic Clustering
When given a section of the DNA sequences of some individuals (of the same species) along with their geographical location, one of the questions asked by biologists is how to split our data into clusters in terms of their geographical distribution, so that the results are consistent with the genetic history. Assuming that mutations occur as a Markov Process and considering appropriate models for the distribution of the demography, the question reduces to a clustering problem subject to the constraints imposed by the genetic history.
We use a migration model defined on the coalescent tree and project it onto the haplotype tree in order to define phylogeographic clusters. Combining it with an underlying model for the geographical distribution of populations and an appropriate evolutionary model, inferences on the joint posterior distribution are possible, avoiding stepwise conditioning. Inferences on the parameters are drawn using Markov chain Monte Carlo samplers
I have been working on a number of different datasets and you can have a look at the type of output I obtain for a specific one. The data is from Beetles on the island of La Palma (in the Canary islands), and their geographical location along with DNA sequence was recorded. Below is a cladogram, i.e. a network in which nodes represent sequences and 2 nodes being connected means that these 2 sequences are 1 mutation apart both in terms of their sequences but also their history. The distinction here is made because sometimes 2 sequences might be 1 mutation apart, however the mutational steps may have taken a different route to reach that result.
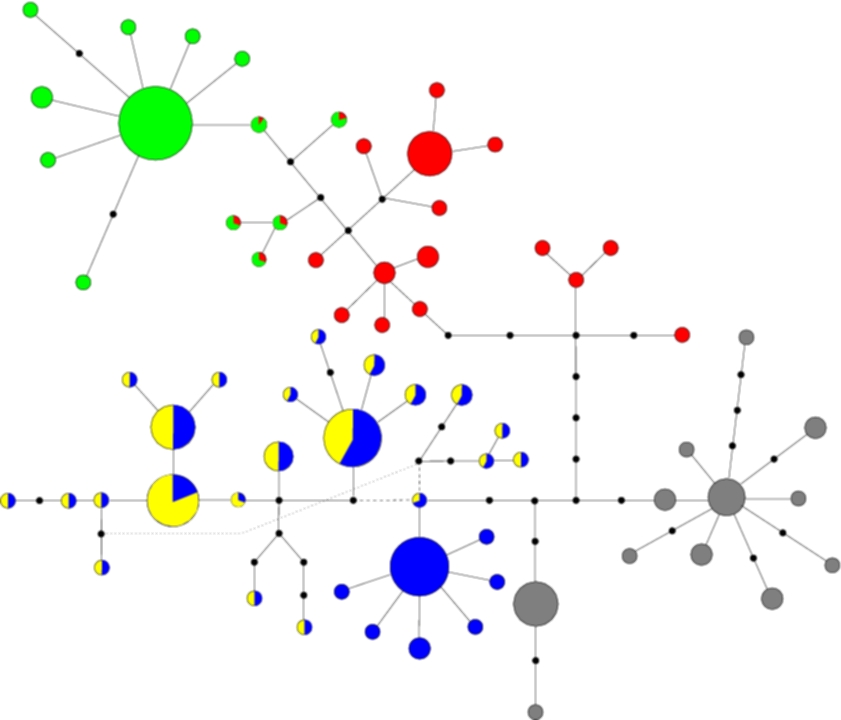
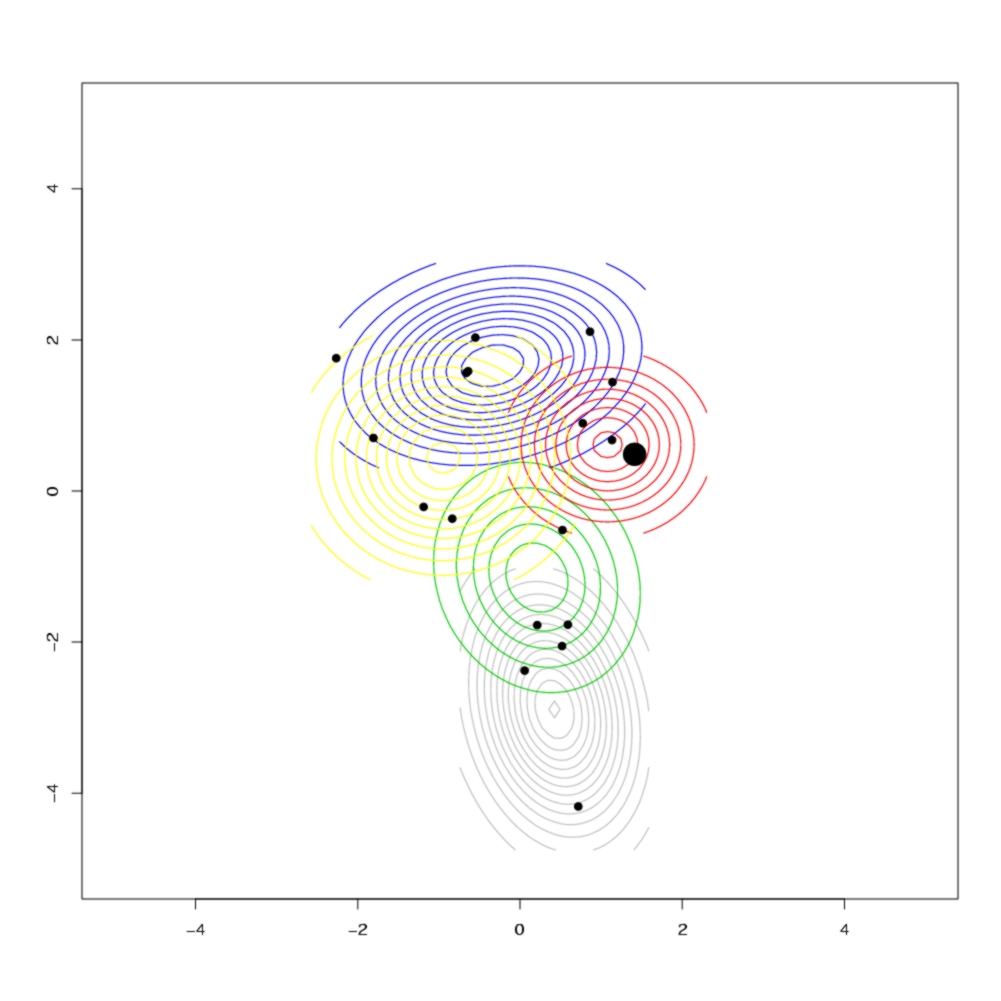
The different colours represent different clusters, which correspond to the geographical clusters shown below in the contour plot of the geographical distribution of each cluster. The size of each node if proportional to the number of observed individuals with that sequence, and black nodes represent unobserved sequences. In the contour plot, the large dot on the right represents the most likely ancestral location, indicating that the island was colonised from the east, which agrees with historical evidence.
Software
Please refer to my software page for an R package implementation of our method.Work in Progress
- Manolopoulou, I., and Hille, A., 'BPC: An R package for Bayesian Phylogeographic Clustering'.
Papers and presentations
- I. Manolopoulou and B. C. Emerson (2012) Phylogeographic Ancestral Inference Using the Coalescent Model on Haplotype Trees. Journal of Computational Biology.
- Manolopoulou, I., L. Legarreta, B. C. Emerson, Brooks, S., Tavaré, S. (2011) A Bayesian approach to Phylogeographic Clustering. Journal of the Royal Society Interface Focus.
- I. Manolopoulou, S. P. Brooks and L. Legarreta. A Bayesian Framework for Analyses of Demographic DNA Sequence Data. Proceedings of the 20th Panhellenic Statistics Conference 2007 "Statistics and Society".
- Brooks, S.P., Manolopoulou, I. and Emerson, B.C. (2007) Assessing the Effect of Genetic Mutation - A Bayesian Framework for Determining Population History from DNA Sequence Data. Bayesian Statistics 8. Oxford University Press.
- I. Manolopoulou (2006) Cladogram Estimation and Analyses of Phenotypic and Phylogeographic Data. Smith-Knight Essay.
- I. Manolopoulou A Bayesian Approach to Nested Clade Analyses.. A talk given at the Cambridge Graduate Students' seminar series 2008.
- I. Manolopoulou, S. Tavaré, S. P. Brooks and L. Legarreta. A Bayesian Framework for Analyses of Demographic DNA Sequence Data. A poster presented at MCMSki II, 2008.
- I. Manolopoulou, S. P. Brooks and L. Legarreta. "A Bayesian Framework for Analyses of Demographic DNA Sequence Data". A poster presented at the 20th Panhellenic Statistics Conference 2007.
- I. Manolopoulou and S. P. Brooks.MCMC Methods on Estimating the Genetic and Geographical History of Individuals. A talk given at the Research Students' Conference in Probability and Statistics 2006.