
Advanced Analytical Methods for Climate Research
Case study 4: Daily Maximum Windspeed in the Netherlands
|
|
Advanced Analytical Methods for Climate Research
|
|
Large areas of the Netherlands are below sea level, and are protected
by a system of dikes. These dikes are continually attacked by waves,
and it is necessary to continually monitor the risk of dike
failure. Since wind is the main source of waves, the Royal Netherlands
Meteorological Institute (KNMI) are
currently undertaking a thorough investigation of the wind climate of
the Netherlands. This investigation is called the HYDRA
project; details may be found here.
As part of the Since the primary concern here is wave damage, it is of particular interest to study extreme windspeeds. This is similar to Case Study 2, where the GLM approach allowed extreme rainfalls to be studied within the context of changing probability distributions. |
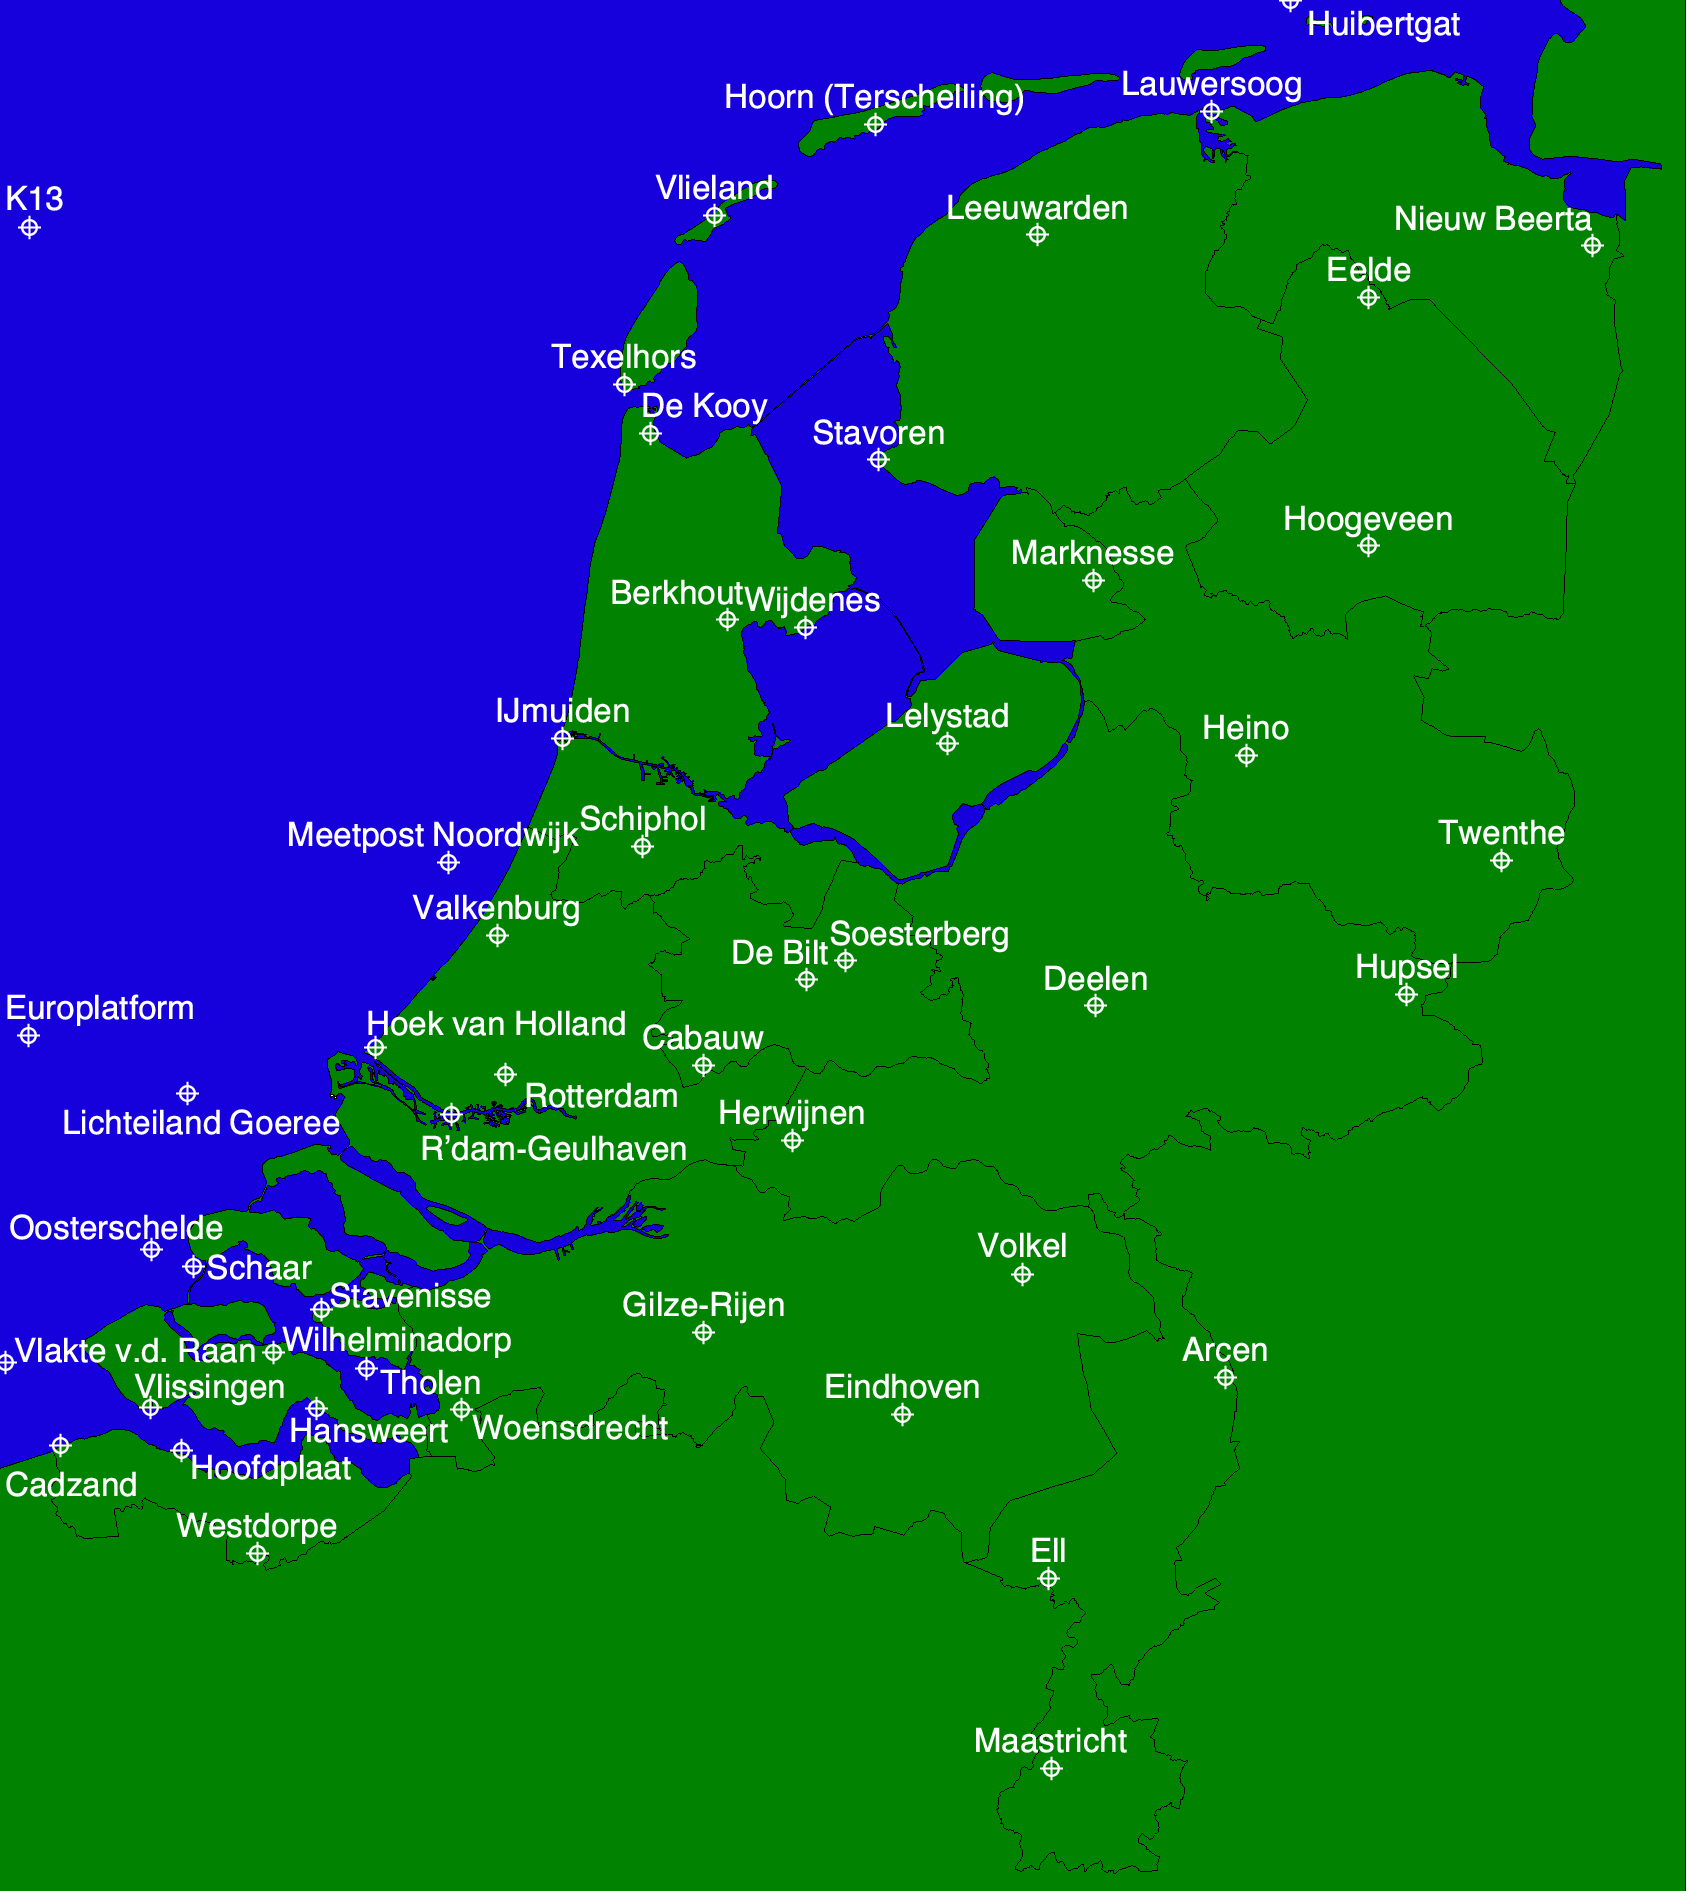
Map provided by Royal Netherlands Meteorological Institute (KNMI) |
|
The data provided by KNMI are hourly. This case study focuses on data
from 9 sites, each of which have continuous records from
1961-1998. The actual data provided below are at a daily timescale,
and have been calculated as the largest of the 4 values at times 0600,
1200, 1800 and 2400 each day. These daily values are referred to as
Daily Maximum Windspeeds (DMWS).
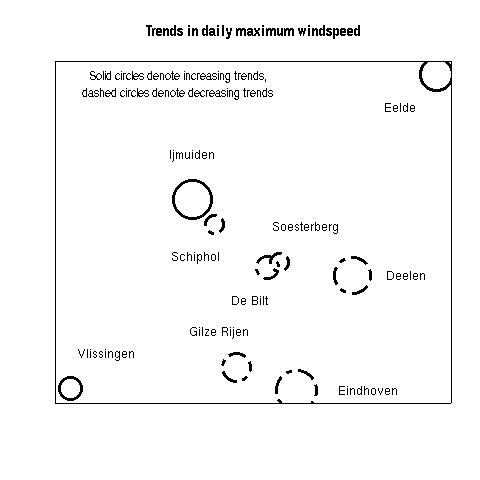
An interesting feature of the DMWS series from these sites is that many of them show strong trends over the 40-year period of record. However, these trends are in opposite directions in different parts of the country. The figure opposite illustrates this. This has been produced by fitting straight lines through annual mean DMWS sequences at each of the 9 sites; the circles in the figure represent the slopes of these lines. The figure clearly shows windspeeds increasing near the coast but decreasing further inland. This pattern is not due to inhomogeneities in the station records (a comparison with NCEP windspeed data over Europe supports this). What is interesting here is the marked differences between DMWS regimes over a small area. |
 |
gaugvals.zip (475K, unzips to
2.4M).
siteinfo.def.
mn_preds.dat.
regions.def (for use in
simulation only).