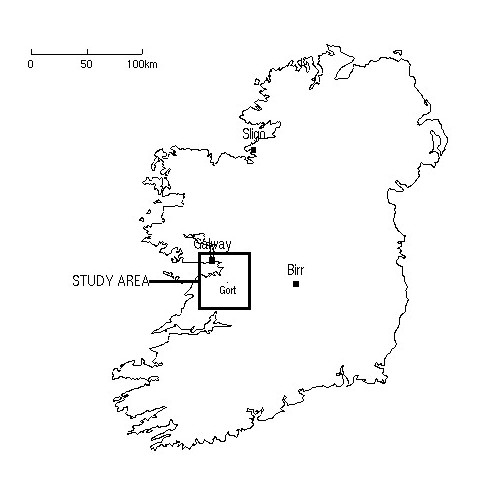
The Galway Bay area of Western Ireland (see figure opposite)
experiences flooding every winter. However, this flooding was
exceptionally severe in the winters of 1990, 1991, 1994 and
1995. Prior to the 1990s, such severe flooding had occurred on average
every 30 years. After the 1991 flood event, the Irish Government
commissioned an extensive study whose aims were:
- To assess the extent to which the flooding was caused by abnormal
rainfall, rather than other factors such as changes in land use.
- To determine whether or not rainfall patterns in the area are
changing systematically.
- To explore a variety of engineering solutions to the flooding
problem, and determine their likely effectiveness.
In order to assess the likely effectiveness of engineering solutions,
it was necessary to provide plausible scenarios, at a daily
timescale, for future rainfall in the area.
|
 |
|
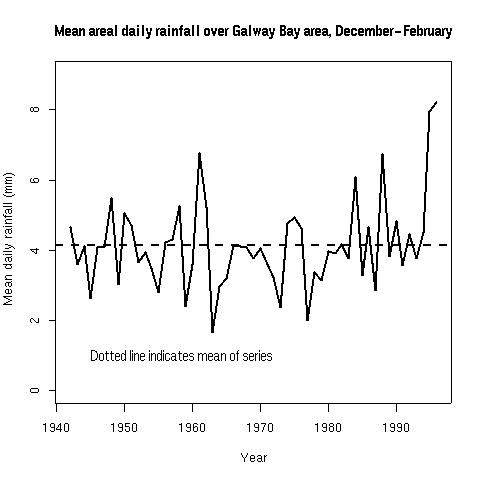
The graph opposite shows the mean daily rainfall amounts over the
study area for the December-February period each year, between 1942
and 1996. It is clear from this that there were some extremely high
winter rainfalls in the area in the 1990s, and that these coincide
with the flooding episodes. There is therefore some systematic
structure in the rainfall record, which is associated with severe
flood events.
Unfortunately, this systematic structure is difficult to
detect in the daily rainfall record, which is very noisy. Ideally, any
analysis of changing climate in this area would be based on means at
monthly timescales or longer to smooth out this noise. However, the
need for future rainfall scenarios at a daily scenario means that
ultimately a study of daily rainfall is required. Generalized Linear
Models are able to identify weak signals in noisy data, and are
therefore particularly appropriate for this kind of
problem.
|
 |
|
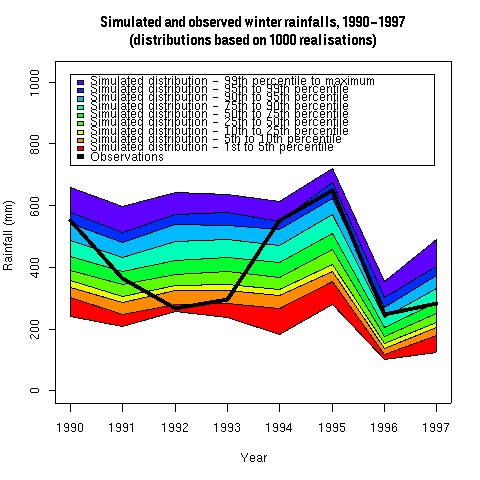
Another feature of GLMs is that they are easy to simulate. Via
simulation, it is possible to obtain probability distributions for
any quantity of interest that can be derived from a daily rainfall
sequence. An example is shown in the figure opposite. Here, 1000
daily rainfall sequences have been generated for the period
1989-1997. From each of these sequences, the areal rainfalls from
December to February each year have been calculated. This gives, for
each year, a distribution of 1000 winter rainfalls against which to
compare the observed rainfall. Hence the extent to which the large
flood events are `extreme' can be judged.
|
 |