|
Bridging Functional and Structural Brain Connectivity: Basics
Brain Organisation
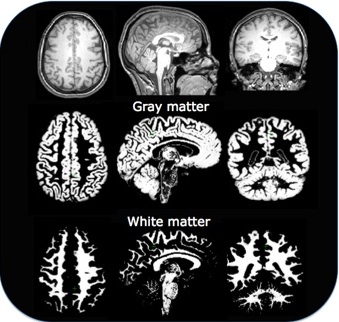
Brain organisation resembles a network that connects areas, which constitute functional units and they are typically specialised to a specific function. These areas consist of neuronal cell bodies, whereas the wiring of the brain is accomplished via neuronal axons. Cytoarchitecture of these areas are fundamentally different, which results in different tissue properties and thus different colours on medical images. Neuronal bodies are usually located in grey matter, which has gray color on T1 MRI images. Neuronal axons are located in white matter, which has brighter color on the same images and hence it can be distinguished. This process is called tissue segmentation and it requires sophisticated computational techniques.
Brain connectivity
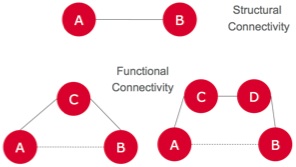
Brain connectivity refers to how functionally specialised units interact with each other. It encompasses both the network's architecture as well as the network dynamics associated with brain function.
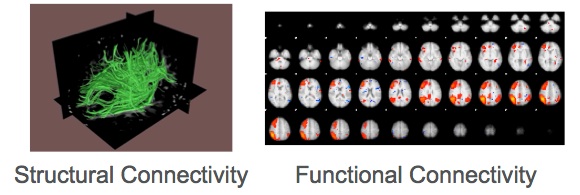
In living human brain, network organisation can be described based on diffusion weighted MRI (DWI). Brain function is usually measured with fMRI. Both imaging techniques provide indirect estimations of brain structure and function, respectively. DWI measures the mobility of brain water molecules. The water diffusion is slower perpendicular to axons than parallel to them. Within tissue with an oriented structure, such as white matter, the diffusion of water is higher in the direction of the fiber tracts. This directional dependence of water diffusion is called diffusion anisotropy and it is exploited by computational techniques to reconstruct neuronal fibers. On the other hand, fMRI measures changes in the blood oxygen levels, which are associated with brain activity. Subsequently, functional connectivity is measured based on the correlated patterns of activity between functionally specialized regions.
 |
|
Network Description
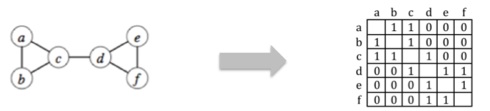
In graph theory, a network is described from nodes and connections. A network can also be represented as a square matrix with elements that represent the connections between each pair or regions. If there is no directionality defined for the connections, the matrix is symmetric. In brain imaging, nodes represent brain regions specialised to a specific task. Connections are represented as scalar values that measure 'strength’ either in structural data or in functional data. Defining the appropriate measure to describe 'strength’ is under investigation. In structural data, it reflects the capacity of the connections to transit a signal and it is therefore associated with fiber density, fiber packing and fiber integrity. In functional data, connectivity is associated with the degree of synchronicity of the signal between two regions and it is usually estimated based on correlation approaches.
Regions of Interest
Atlas-based ROIs are defined very accurately based on anatomical landmarks, which are manually segmented to provide a set of regions, as shown at the figure on the right hand side. Although manual segmentation is prohibitively time-consuming, there are automated ways to propagate the segmentation from one subject to another. This involves non-rigid registration of the manually segmented images to the new. Altas-based segmentation is merged with tissue segmentation to provide ROIs in gray matter. Note, that atlas-based ROIs do not reflect accurately functional specialisation of the regions.
Connectivity-based ROIs can be derived based on either structural connectivity data from DWI or functional connectivity data from fMRI. The main concept is that the neurons that fire together they have similar functionality and thus they are also wired in a similar manner. Therefore, connectivity-based ROIs can be identified based on clustering approaches that group together voxels with similar connectivity profile.
Whole brain connectivity description
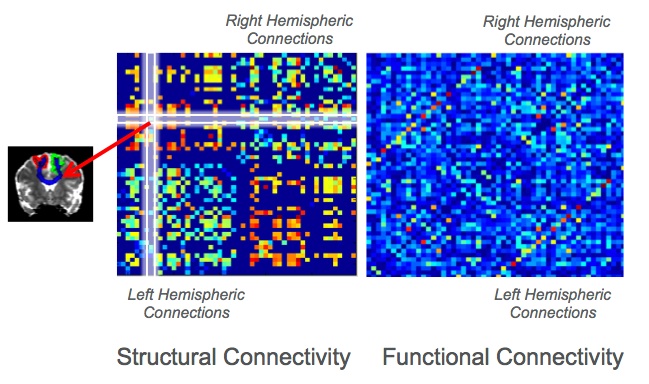
A connectivity matrix is a compact and systematic way to represent a brain network. For example, whole-brain structural connectivity matrices show direct structural connections between each pair of cortical regions. We choose to plot ROIs by cerebral hemispheres, with right-hemispheric ROIs in the lower left quadrant, left-hemispheric ROIs in the top right quadrant, and inter-hemispheric connections in the upper left and lower right quadrants. The colormap reflects the strength of each connection with deep blue representing the smaller values and red the highest values. Deep blue represents zero for structural connectivity or negative values for anti-correlated functional connectivity. The off-diagonal elements that appear as parallel lines to the main diagonal are inter-hemispheric connections between homologous regions.
Indirect Functional Connectivity
Although, we have characterise functional and structural connectivity with a similar form, a symmetric square matrix, yet there is still a fundamental difference: The absence of a structural connection does not correspond to the absence of a functional connection. We can observe synchronised activity between two regions even when there is no direct structural link that connects them. In this case, they are connected indirectly via one or more other regions. We call this indirect functional connectivity.
We can use the partial correlation matrix to disentangle the influence of other regions on a connection. Partial correlation matrix can be estimated from correlation matrices with inversion to derive the precision matrix and subsequently scaling the diagonal to one. In this context, the absence of a functional connection corresponds to the absence of a structural connection and vice-versa. Note that inversion requires a well-conditioned matrix with non-zero eigenvalues. Recall that inversion of zero is infinity and similar singularities can be observed when we invert a matrix.
|