|
This case study was originally motivated by a request from a
reinsurance company. Their business is such that they will suffer
financially as a result either of unusally hot summers
or of unusually cold winters, anywhere in the United
States. In the context of this lecture series, the case study serves
as a good example of how the GLM approach can be applied to the
modelling of climate at a continental scale. The problem considered
here is to model monthly mean temperatures at any location in the
USA. The data available are monthly mean temperatures from 2600
weather stations, for a 50-year period - the dataset has a total of
one and a half million observations.
An interesting feature of monthly temperature data is that its
variance changes systematically with factors such as latitude and
season. This needs to be modelled explicitly. This can be achieved
using a combination of two GLMs. The approach, which is quite a
sophisticated application of the theory, will be described in the
lectures.
| 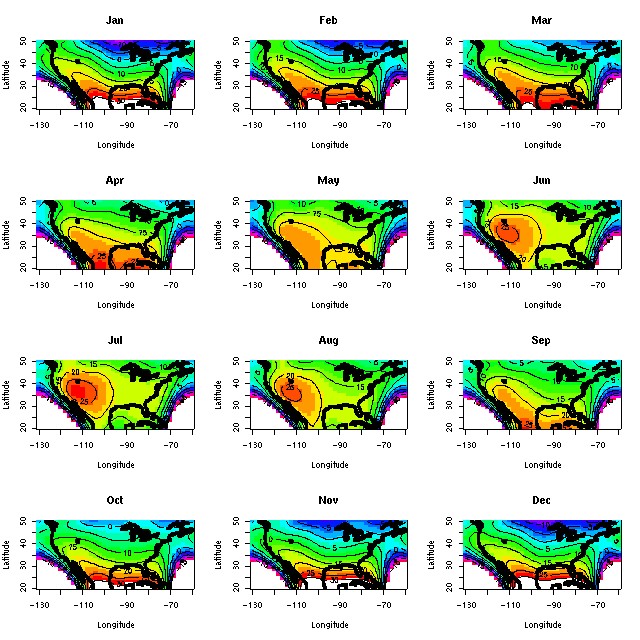 |
| The figure above gives an example of information that
can be extracted from a GLM. It shows the systematic regional
variations in temperature in the United States, at different times of
year. Such maps can be produced straightforwardly once models have
been fitted. In this case, the result is not particularly interesting
from a scientific point of view. However, it does show how the
structure of a GLM may subsequently be interpreted. The ability to
produce maps such as this is particularly useful for many
climatological applications. For example, it is possible to produce
maps showing the effect of phenomena such as ENSO, over a large area,
at different times of year. Of course, these maps just show average
effects. Differences in extremal behaviour may be much larger than
this, but can be quantified by simulation if necessary.
|