Emacs carnival: Ode to org Babel
A blog post as a contribution for November's Emacs Carnival.
Not quite an ode
I'm not a poet so I won't make you suffer through an attempt of mine in writing an actual ode. Instead, given one definition of an ode,
[…] a poem characterized by sustained noble sentiment and appropriate dignity of style.
taken from The Collaborative International Dictionary of English,1 I will attempt prose with the appropriate sentiment and dignity. 🙂
In a previous Emacs Carnival blog post, I already mentioned that the ability to mix prose with code was one of the key features in org mode in Emacs that made writing easy and enjoyable. In that blog post, I used an example of embedded PlantUML code within an org file to generate flowcharts. Although a useful example, this but illustrates the most minimal use of org babel. In this blog post, I hope to show that org Babel can do much more, especially in the context of analysing data.
Data processing and visualization
The example of the use of org Babel that I wish to present is the analysis of the performance of an optimization method for a challenging problem in process design. I'll not go into the details of the problem here but will instead concentrate on the analysis of the types of data I often encounter. In this case, I am using a stochastic optimization method for a problem that is multi-modal, having many local optima. Each run will often find a different solution. What I am interested in knowing is how often specific solutions are found with the eventual aim of gaining some insight about the properties of the design space.
If I solve the problem 100 times, say, I end up with a table of outcomes, named results, that looks like this (truncated for illustration purposes):
| 0.006780639787578286 |
| 0.006780639787578433 |
| 0.008195683980621288 |
| 0.006780639787578433 |
| 0.006780639787578286 |
| 0.006780639787578286 |
| 0.008195683980621288 |
| 0.006780639787578433 |
| 0.006780639787578286 |
| 0.0071466305079598775 |
| 0.01154503021335327 |
This table shows the value of the objective function for each run. Using org Babel, by incorporating gnuplot code, we can easily generate a box plot
of the full data set. In this, the src block has a header line
#+begin_src gnuplot :var data=results :file images/emacs-carnival-babel-boxplot.png :exports both :cache yes
which references the table above and has the following contents:
reset
set border 2
set style data boxplot
set boxwidth 0.4 absolute
set xrange [0.5:1.5]
set xtics 1
set yrange [0.004:0.018]
set ylabel 'Objective function'
set ytics nomirror 0.005, 0.003
unset key
unset xtics
plot data using (1.0):1 ps 0.2
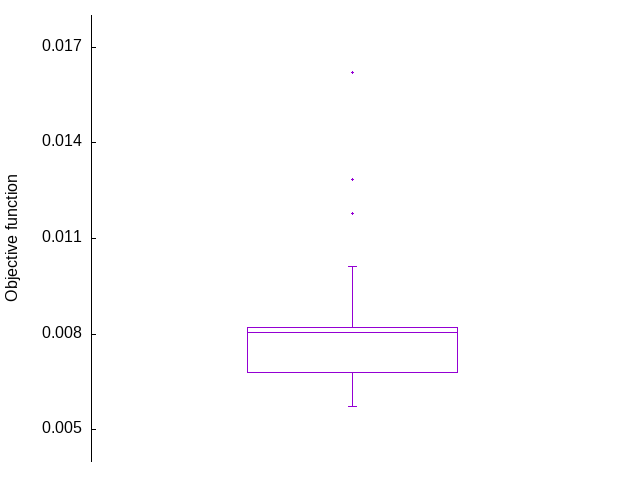
Figure 1: Box plot of objective function values found for an optimization problem.
The box plot shows that the average objective function value is approximately 0.008 and that there are a significant number of values below this average. Eventually, we will be interested in seeing whether there is any pattern to the solutions obtained.
For this small number of runs, we can see directly by inspection of the small truncated table that the most common outcome has an objective function value of approximately 0.00678. This is consistent with the box plot shown above. If we were to look at the full table of outcomes, however, inspection by eye would be subject to error or bias possibly. So, for the larger data set, we consider using code to analyse the outcomes and then provide a visual representation of this analysis. I use org Babel for this to have the code and analysis results within the same file where the data reside.
First of all, a little awk script to count up different outcomes in the original table:
{
    if ($1 != "hline") {
        s = substr($1,2,9)
        n[s] += 1;
    }
}
END {
    for (val in n) {
        printf "%7.5f %d\n", val, n[val]
    }
}
The header line for this script is
#+begin_src awk :stdin results :exports both :results output :cache yes :post sort(data=*this*)
This script will output a table of counts for each objective function value found, based on the seven digits considered ("0." followed by 5 decimal values). However, the table of values created by the awk script will not be in any particularly useful order so we post-process the output by passing it through another org Babel script using the :post sort(data=*this*) directive. The sort script, with header line
#+begin_src shell :var data="" :results output table :exports code
is:
sort -n << EOF
$data
EOF
The outcome of the combined awk and shell scripts is this table, named frequency to be able to reference it later:
| 0.00573 | 16 |
| 0.00678 | 24 |
| 0.00715 | 4 |
| 0.00804 | 3 |
| 0.0082 | 20 |
| 0.00946 | 3 |
| 0.01013 | 11 |
| 0.0118 | 1 |
| 0.01285 | 6 |
| 0.0162 | 1 |
With this table, I now use gnuplot to visualise the outcome with header line
#+begin_src gnuplot :var data=frequency :file images/emacs-carnival-babel-frequencyplot.png :cache yes
and code
reset
set border 3
set style data histogram
set xlabel 'Objective function value'
set xtics nomirror rotate out
set ylabel 'Frequency (%)'
set yrange [0:*]
set ytics nomirror out 10,10
unset key
plot data using 2:xticlabels(1)
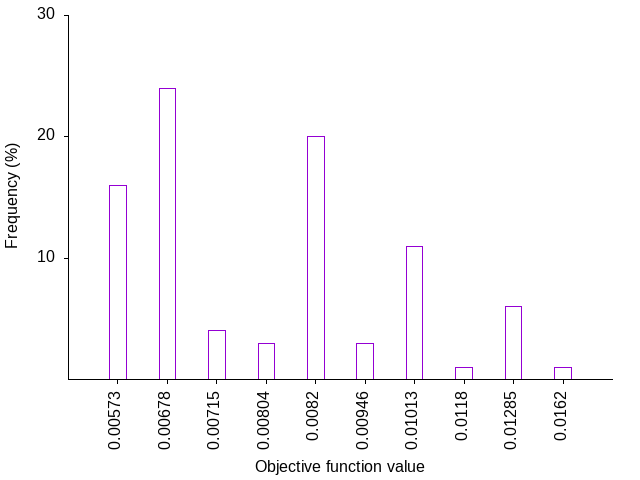
Figure 2: Histogram plot of the occurence of each objective function value.
Note that I probably could have chained this gnuplot Babel block with the previous shell script and had the plot be generated directly from the original data. I have not tried this primarily because I am interested in having the frequency table explicitly.
Conclusions
This blog post hopefully illustrates some further capabilities of org Babel. The example has included four org Babel src blocks, illustrating accessing and creating tables of data, using a variety of languages, and with data transfer directly by chaining org Babel blocks. The main benefit, for me, is having all processing done in one place, not having to go around looking for different files for the data and the codes used to analyse the data.
Blog navigation
| Previous post | Blog | Next post |
|---|---|---|
| QTHEN: 5. The QTHEN Julia package for heat exchanger network design | Index | Emacs carnival: Mistakes and misconceptions |
You can find me on Mastodon or you can email me should you wish to comment on this entry or the whole blog.
References
Footnotes:
Accessed, obviously and most appropriately, using dictionary-search from within Emacs