 coggame
Cognitive Flexibility and Real-Time Strategy Game - A Project Repository
Is human cognitive flexibility flexible, or is cognitive flexibility a fixed ability from birth? If cognitive flexibility is a mutable human characteristic, what is the best way to improve it? To answer these questions, psychology must determine why some training regimens lead to specific learning and others lead to generalized learning. Video gaming has caught the interest of the psychological community due to the diversity of cognitive demands inherent in a single video game. Because of this complexity, it is unclear what leads to a successful video game training regimen. To determine which aspects of video gaming lead to enhanced cognitive flexibility, the current study compares two versions of a real-time strategy game against a life-simulator control game. Only those in the gaming condition requiring more maintenance and switching between multiple information and action sources demonstrated enhanced cognitive flexibility. Game feature analysis reveals that those in the richer gaming condition indeed attended to an expanded set of gaming features.
This is a repository of the methodology, code, and collected data used
to complete this project.
The University of Texas at Austin
- Paper & Press
- Video games
- Video game recorded data
- Psychological Task Battery
- Data Repository
- Contact information
- References
Paper & Press
![]()
Featured on NBC Nightly News - September 9, 2013
- Study: playing Starcraft can increase your cognitive abilities | Wired
- Strategy-Based Video Games, Like Starcraft, Improve Brain's 'Cognitive Flexibility' | The Huffington Post
- Want to train your brain? Play StarCraft | C-Net
- Playing StarCraft could boost your cognitive flexibility | Slashdot
- Video games aid thinking skills | British Psychological Society
- Playing video games may boost brainpower, strategic thinking skills - NY Daily News
- Strategize a Smarter Brain | Men's Health
- Playing Video Games Can Boost Fast Thinking | Psych Central News
- Some Video Games May Boost Brain's Flexibility, Study Finds | WebMD
- Try video games to boost memory, agility | Red Bluff Daily News Online
- Try video games to boost memory, agility | The Denver Post
- Try video games to boost memory, agility | The Mercury
- StarCraft can boost cognitive flexibility and strategic thinking | VG Researcher
- Some Video Games May Boost Brain's Flexibility, Study Finds - Health News and Views | Health.com
- Playing video games gives brain a buzz | TruthDiveTruthDive
- Video games boost brain flexibility | Health24
- Asal Tidak Lupa Olahraga, Main Video Games Bisa Bikin Otak Makin Fleksibel | Detik Health
- Claim: Playing video games can boost brain power | TG Daily
- Video Game Playing Boosts Brain Power - Technology News | redOrbit
- Video Games Improve Decision Making, Brain Power; Real-Time Strategy Games Like 'StarCraft' Can Boost Cognitive Flexibility | Medical Daily News
- Videogames 'can help to develop mental flexibility' | Zenopa
- Games might boost brain power, suggests new study | IncGamers.com
- Playing games CAN boost brain power, study shows - but not the ones you expect | Yahoo! News UK
- Playing Certain Video Games Boosts Brain Power | Headlines & Global News
- New study claims StarCraft improves players' cognitive flexibility | Tech2
- Estudio determina que jugar 40 horas de StarCraft mejora tus habilidades cerebrales | BioBioChile
- Estudio afirma que StarCraft te hace más inteligente | LevelUp
- Studio: StarCraft II può migliorare l'abilità del cervello nel problem-solving | GAMEmag
- Videojuegos, una terapia cerebral | El Comercio
- StarCraft 2 - Macht Intensiv-Spieler laut neuer Studie klüger | GameStar.de
- Studie: PC-Spiele machen das Gehirn flexibler | Hardware-Infos
- Video Game Improves Cognitive Control in Elderly? Gaming Boosts Brain's 'Flexibility' To Reverse Negative Affects of Aging (VIDEO) | Headlines & Global News
Video Game - StarCraft
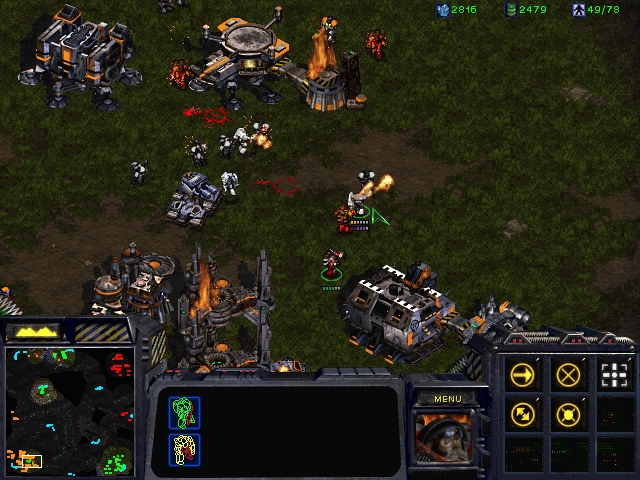
A modified version of StarCraft is used. The modification uses the Bwapi interface. ChaosLauncher is used to start StarCraft and inject the modified dll. A Visual Basic program (i.e., a wrapper) is used as the main entry point for the participant. The wrapper program is responsible for the titration level procedure, the map manipulation, and starting ChaosLauncher (which in turn injects the Bwapi code).
Video example of StarCraft game play
Wrapper
A Visual Basic windows executable program is the primary entry point for the participant. A desktop icon points directly to the wrapper, which has a single button. When the participant clicks this button and confirms the following instruction message, the game automatically starts. The wrapper is responsible for determining the current game map and the current game difficulty.
Game Manipulations
Within-Subjects Titration Level
The game difficulty is determined by whether the participant won or lest the previous game using the current map. If the participant won, the next game is one level higher in difficulty. If the participant lost, the next game is one level lower in difficulty. The level starts at 1 and can increase to 16. At higher difficulty levels, the computer-controlled opponent has more starting resources and thus more difficult to defeat.
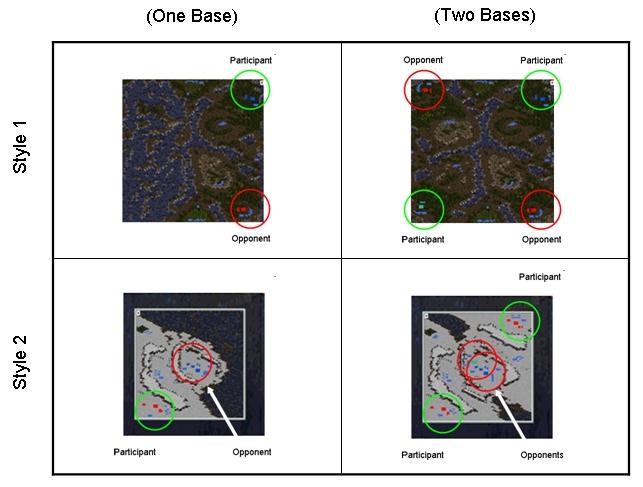 |
Within-Subjects Map ManipulationGames alternate between two different maps. In Map 1, the opponent is in the corner of the map, while in Map 2 the opponent is in the center of the map. The maps also differ qualitatively in the terrain type. Map 1 has a forest theme, while Map 2 has an arctic theme. Between-Subjects SC ManipulationThere are two between-subjects conditions within the StarCraft condition: SC-1 and SC-2. In SC-2, there are two participant bases and two opponent bases. In SC-1 version, there is one participant base and one opponent base, and half of the map is blocked out (with unusable terrain).
|
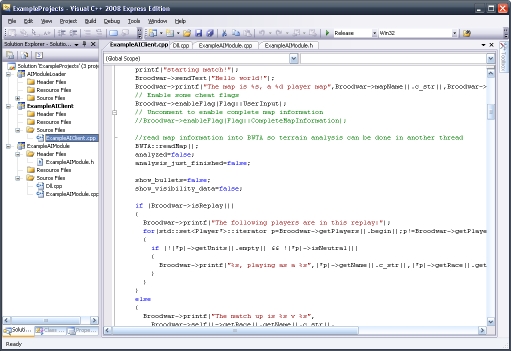
Bwapi CodeBwapi is an API for interacting with Starcraft: Broodwar (1.16.1). It
is an open source project constructed with C++. It is recommended to
use Visual C++ Express Edition to edit and compile
the code. Bwapi scripts are compiled as DLL files which are injected
into the StarCraft game using ChaosLauncher (see below).
|
 |
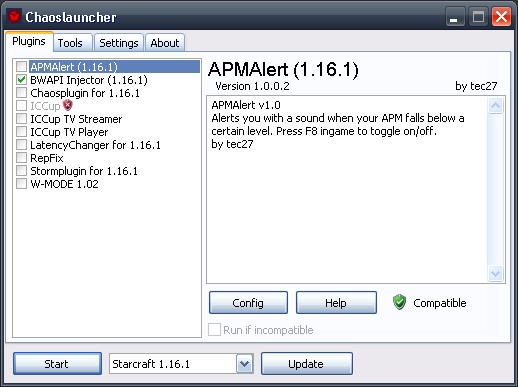
ChaosLauncherChaosLauncher is a plugin launcher that allows for various modifications to be used when StarCraft is run. For our purposes, we use ChaosLauncher to run StarCraft and inject the Bwapi DLL. ChaosLauncher should be set up to run automatically on startup. The wrapper runs ChaosLauncher, which in turn starts StarCraft with the Bwapi code. It also automatically navigates through the StarCraft menus, so that the participant only needs to press "Start Game" once StarCraft fully initializes.
|
 |
StarCraft Alert Modifications
In StarCraft, there is a minimap at the bottom left of the screen. This is useful for normal play because it alerts the player when various situations have occurred in distant (and currently not viewed) parts of the map. However, we preferred our participants to not be alerted of distant situations. To remove the minimap alerts, the custom animation files were decompressed, altered, and recompressed using freeware StarCraft modification tools. The resulting modified file is available in the downloads section. It is used by replacing the original file in the StarCraft directory.
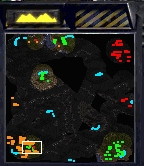
StarCraft Minimap
Recorded Data
During each StarCraft game, two data files are created. One is a small file containing information about the game. The other is a large file comprised of several different game features. After each game, a time file is also updated to include information about the length of each game played.
Game Information File
These text files contain a summary of one completed game. An example of the file name format of these files is:
output_end_ABC123_15_1_4.txt
Where, ABC = Participant initials
123 = Participant number
15 = Game number (e.g., the 15th game played)
1 = Map number (1 or 2)
4 = Difficulty level (1 to 16)
The columns represent the following:
Opponent race (1 = Terran; only Terran is used)
Number of key presses
Winner (1 = Player, 2 = Opponent, 3 = Game ended prematurely)
Player's cumulative gas collected
Player's cumulative minerals collected
Opponent's cumulative gas collected
Opponent's cumulative minerals collected
An example of the contents is as follows:
1 0 2 12864 7542 6524 9550
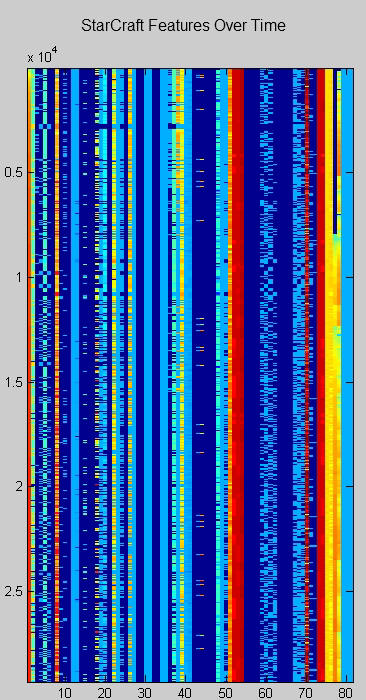
Unit Feature File
These text files contain a large amount of game information recorded every time step (250msec). An example of the file name is:
output_data_ABC123_16_2_7.txt
At each time step, one row of data is recorded for each of the participant's StarCraft units. There can be as many as 200 units available at any time step. Note that some of the features are potentially meaningful while others are not. This was done for cross validation purposes. The columns represent the following information (relative to the specific unit at hand):
|
|
Time File
The time file is created by the wrapper program and is saved as ct.txt. This file contains a list of how long the games lasted. The times are stored in units of milliseconds, and all are multiples of 250msec (the length of one time step).
Video Game - The Sims
The Sims operates as a control condition. Game play in this life simulation game consists of managing the lives of simulated characters that populate a virtual town. The game requires a low level of attentional multitasking and there are no specified or rigorous goal states to achieve as in StarCraft. A Visual Basic program (i.e., a wrapper) is used as the main entry point for the participant.
Video example of The Sims 2 game play


Wrapper
A Visual Basic windows executable program is the primary entry point for the participant. A desktop icon points directly to the wrapper, which has a single button. First, the participant clicks this button to begin "recording" game play. Second, the participant starts The Sims from a desktop icon. The wrapper detects whether the game has started or ended, and records the time spent playing.
The compiled executable for this wrapper as well as the Visual Basic code are available in the downloads section.
Recorded Data
The Sims saved game information was copied from each participant's computer after completion of the study. The saved game information consist of the following folders, found in \Documents and Settings\user\My Documents}:
\EA Games\The Sims 2\Cameras
\EA Games\The Sims 2\Collections
\EA Games\The Sims 2\Config
\EA Games\The Sims 2\Groups.cache
\EA Games\The Sims 2\Logs
\EA Games\The Sims 2\LotCatalog
\EA Games\The Sims 2\Movies
\EA Games\The Sims 2\Music
\EA Games\The Sims 2\Neighborhoods
\EA Games\The Sims 2\Projects
\EA Games\The Sims 2\SC4Terrains
\EA Games\The Sims 2\SavedSims
\EA Games\The Sims 2\Storytelling
\EA Games\The Sims 2\Teleport
\EA Games\The Sims 2\Thumbnails
Time File
The time file is created by the wrapper program and is saved as ct.txt. This file contains a list of how many minutes the games lasted and when they were played. The following is an example:
8/27/2011 6:35:39 PM 34
8/28/2011 1:29:33 PM 23
8/28/2011 2:32:29 PM 61
8/30/2011 3:33:58 PM 19
8/30/2011 4:27:17 PM 45
8/31/2011 12:35:13 AM 48
8/31/2011 11:40:11 PM 41
9/1/2011 11:04:30 PM 95
9/4/2011 3:02:34 PM 134
9/5/2011 5:28:59 PM 143
9/6/2011 12:05:50 AM 126
9/8/2011 11:14:29 PM 12
9/9/2011 12:31:52 AM 75
9/11/2011 11:33:52 PM 113
9/12/2011 11:56:38 PM 70
9/14/2011 12:00:22 AM 58
9/17/2011 9:06:20 PM 115
9/23/2011 11:51:59 PM 22
9/26/2011 12:06:34 AM 66
10/2/2011 10:56:38 PM 41
10/3/2011 11:46:03 PM 46
10/6/2011 11:16:21 PM 130
10/8/2011 3:31:48 PM 26
10/9/2011 2:19:39 PM 63
10/10/2011 11:10:59 PM 20
10/12/2011 11:30:51 PM 26
10/13/2011 12:10:45 PM 107
10/14/2011 12:04:38 AM 52
10/15/2011 4:38:47 PM 45
10/16/2011 8:48:06 PM 27
10/17/2011 12:21:58 AM 39
10/17/2011 12:08:56 PM 153
10/19/2011 8:52:48 PM 127
10/20/2011 5:56:37 PM 85
10/22/2011 1:30:20 PM 124
These data files can be downloaded in a compressed format from the downloads section.
Psychological Task Battery
This is a description of the psychological task battery. Each participant completed the task battery three times: Pretest, Mid-test (after 20 hours of gaming), and Post-test (after 40 total hours of gaming)
The following battery of tests is designed to cover a wide range of cognitive abilities, and not only those that we hypothesize to be affected by RTS gaming. The measured constructs include attentional control, memory, perceptual abilities, and risk taking.
Task Switching
The task switching paradigm (Monsell, 2003) is a dual stimulus-classification procedure during which the participant must switch back and forth between two different task modes. During one mode, the participant identifies a letter as a vowel or consonant. During the other mode, the participant identifies a number as even or odd. After training on both modes, the participant switches between the two task modes. Switch costs are calculated by the reaction time difference between items which followed an item from the same task mode versus items which occurred after a switch in task mode (Ophir, Nass, & Wagner, 2009).
On each trial, participants were cued for 200msec with "NUMBER" or "LETTER", depending on the trial type. The stimuli consisted of a number/letter pair (e.g., "4n" or "n4"). On number trials, the participant indicated whether the number was even or odd. On letter trials, the participant indicated whether the letter was a vowel or consonant. Letters were chosen from the set {a, e, i, o, u, p, k, n, s}; Numbers were chosen from the set {2, 4, 6, 8, 3, 5, 7, 9}. The interval between cue and stimulus onset was 226msec, while the intertrial interval was 950msec. First, the participant completed three practice sets: letter task only, number task only, and switching practice. Next, the participant completed four 80 trial test blocks. Each block had a 40% switch rate, and all contained the same number of 1-, 2-, 3-, and 4-streak sequences. The task takes approximately 20 minutes to complete.
Code for running task switching task is available in the downloads section, and requires the E-Prime run time (available for free).
Analysis code is available in the download section. After pre-processing of the E-prime data files, processed files are created with the following columns:
- Trial type (1 = letter task, 2 = number task)
- Accuracy (1 = Correct, 0 = Incorrect)
- RT msec
Information Filtering
The information filtering task (Vogel, McCollough, & Machizawa, 2005) involves the detection of change (or lack of change) in sequentially presented scenes. Participants were shown scenes consisting of red and blue rectangles with differing orientation for 100msec. They were instructed to ignore the blue rectangles and focus only on the red rectangles. The scene was removed for 900msec and then replaced with a new scene. Participants were asked to respond within 2000msec whether one of the red rectangles had been rotated in the new scene. The target red rectangle was either not rotated or rotated by 45 degrees clockwise or counterclockwise. Thus, the participant must filter the scene information by ignoring blue bars and detecting whether red bars have changed. The intertrial interval was set to 200msec. Scenes included 0, 2, 4 or 6 blue distractors, and 2, 4, 6, or 8 red distractors. The rectangles did not overlap (nor were within one rotation of overlapping) and were distributed evenly across the scene. The total number of rectangles never exceded 8, thus 10 combinations were possible. There were an equal number of combinations shown, trial order was randomized across subjects, and the number of change and no-change trials was equivalent. There are 256 trials, and the task takes approximately 25 minutes to complete.
Code for running the information filtering task is available in the downloads section, and requires the E-Prime run time (available for free).
Analysis code is available in the download section. The data files are formatted with the following columns:
- Combination type (1st digit = Number of red, 2nd digit = Number of blue)
- RT msec
- Participant Response (4 = Yes, 5 = No)
- Answer (4 = Yes, 5 = No)
The Multimedia Multitasking Index (MMI)
The MMI is an index of simultaneous media consumption developed by Ophir, Nass, and Wagner (2009). The participant is presented with a matrix of possible media combinations and self reports who often he or she simultaneously engages in both of the media types. These pairwise reports and weighted with self reported time spent engaging in each medium, and then summed into one score. The developers of the measure found that MMI correlates negatively with the above mentioned information filtering and task switching tasks. In other words, those who tend to multitask more often tend to also be worse at task switching and information filtering.
The questionnaire has two phases: 1) Hours spent on each medium, 2) Pairwise multitasking frequency.
1) The participant indicated how many hours per week she spends engaging in the following media types:
- Print media
- Television
- Computer-based video (e.g., YouTube)
- Music
- Nonmusic audio
- Video or computer games
- Telephone and mobile phone voice calls
- Instant messaging
- Text messaging
- Web surfing
- Other computer-based applications (e.g., word processing)
2) A matrix was displayed of each pairwise combination, and the participant responded for each combination how often she simultaneously engages in both forms of media (e.g., Telephone while Web surfing) -- The options were "Most of the time", "Some of the time", "A little of the time", and "Never". Rows and columns were blacked out for media types which the participant responded 0 hours/week in part one. The questionnaire takes approximately 5 to 10 minutes to complete.
For scoring purposes, the matrix responses were assigned numerical values of 1, 0.67, 0.33, and 0. Then, a subscore for each media type was calculated by multiplying the matrix response by the number of hours, and dividing this product by the total number of hours. These subscores were then summed into one final MMI score.
The questionnaire is administered via a Visual Basic program that is available in the download section. The program outputs two files, a response file and a score file. The response file includes all the individual responses. The score file includes the final MMI score and the average number of hours spent consuming media per week.
Multi-location Memory Task
A novel memory task was developed for the purpose of the present investigation. We found that the above task switching paradigm did not require retention of the state of the previous task when switching. Other researchers have attempted to tackle this problem using a primary task which is interrupted by a secondary task, throughout which the state of the primary task must be retained (Charron & Koechlin, 2010). Both tasks were the same and involved spelling the word ‘tablet’ one letter at a time. We expanded on this idea by developing a paradigm involving math operations. For this task, one of two screen locations is active for any given trial. After a single initialization trial during which two green zeros are shown at both location, the participant is shown a white number at one of the locations. The participant responds whether the sum of this white number and the previous green number shown at that location is odd or even, and then a new green number is shown at that location. Thus, the participant must retain the number at the previous location in order to do well. Switch costs of accuracy and reaction time are possible to calculate. Also, it is possible to sort the switch costs by the length of the previous streak.
The participant completed a 30-trial practice block followed by a 100-trial testing block. Before the first trial of each block, two green zeros are shown simultaneously for 0.5 seconds, one at the left location and one at the right location. Then, the zeros are removed and the block begins. Throughout the block, each location is indicated by a white rectangle. On each trial, one of the two locations is cued by the white rectangle becoming thicker for 0.5 seconds. Then, a white number is shown at the cued location (picked randomly from 1 to 9). The participant then indicate whether the sum of the current white number and the green number to be previously shown at that location was even or odd. The white number was cleared from the screen upon response. After 250msec, a new green number was shown at the current location for 0.5 seconds. The next trial began after this 0.5sec delay. The location was selected randomly with equal probability on each trial, although the maximum streak length was set to 10. This is exceedingly rare, since a streak of 10 occurs on only 1 out of 2^10 trials. In the practice block, corrective feedback and detailed instructions were displayed for the first 10 trials to ensure the participant understood the instructions. The entire task tasks approximately 15 minutes to complete.
Matlab code for this experiment is available in the download section. Data files have the following column structure:
- Block number
- Trial number
- Location (1 = Left, 2 = Right)
- Number of trials since switch (for last trial)
- Number of trials since switch (for current trial)
- Previous number
- Current number
- Correct answer (1= Even, 2 = Odd)
- Participant response
- Accuracy (1 = Correct, 0 = Incorrect)
- RT sec
Matlab code to analyze this experiment is available in the download section.
Visual Search
The visual search task (Castel, Pratt, & Drummond 2005) involves the identification of a target in an array of items. There are two trial types: hard and easy. Easy trials have fewer items (4), and hard trials have more (12). All items were represented by white bars on 75% gray disks against a 25% gray background. The target item, if present, had a vertical white bar. Non-target items had white bars that were rotated 45 degrees clockwise or counterclockwise. There were an equal number of target and non-target trials, as well as an equal number of easy and hard trials, with the ordering determined randomly. Items were located randomly on the vertices of an imaginary six by six array (36 possible locations) with vertices spaced 100 pixels apart horizontally and vertically. Disks were 40 pixels in diameter, bars were 6 pixels in width. On each trial, a fixation cross was displayed for 500msec, followed by the response terminated item array. Corrective feedback was displayed for 1sec, followed by a 500msec inter-trial interval. The task consisted of two block, each containing 5 practice trials and 96 test trials. The task took approximately 15 minutes to complete.
Matlab code for this experiment is available in the download section (requires PsychToolBox 3). Data files have the following column structure:
- Block number
- Practice trial (1 = Practice, 0 = Test)
- Number of Distractors (4 = Easy, 12 = Hard)
- Target present (1 = Present, 0 = Absent)
- Participant error (1 = Incorrect, 0 = Correct)
- RT msec
Matlab code to analyze this experiment is available in the download section.
Stroop
The Stroop Test involves three verbal subtests during which the experimenter counts the number of correct and error responses within 45 seconds. First, the participant reads a list of words which include “Red”, “Blue” and “Green” in random order and printed in black ink. Second, the participant is presented with a list of X’s printed in red, blue or green ink and must say the color of the X’s aloud. Lastly, the participant is presented with a list of the three color words in which every word is printed in a different color ink than indicated by the printed word itself (e.g., “Red” printed in green ink). For each subtest, the experimenter instructs the participant to read the printed items aloud (or say the color of the printed items) as quickly as possible. The experimenter counts the number of completed items along with the number of errors made by the participant in 45sec. The scores from the three subtests are combined using standardized procedures to create an interference score. This score has been shown to correlate with frontal lobe functioning, speed of processing, and selective attention (Howieson, Lezak, & Loring, 2004). The task takes approximately 4 minutes to complete.
Scored results for the Stroop task are available in the download section, although the test was administered on paper by an experimenter.
WAIS-IV Digit Span
The WAIS-IV digit span task involves remembering and repeating back sequences of numbers ranging in length from 2 to 9, and both forward and backward. For each length, the participant attempts to recall two sequences. If the participant recalls at least one of the sequences correctly, then the experimenter proceeds to the next sequence. This repeats until the participant is unable to recall either sequence. A combined accuracy z-score is calculated using standard procedures (Wechsler, 2008). The task takes approximately 4 minutes to complete.
Scored results for the Digit Span task are available in the download section, although the test was administered on paper by an experimenter.
Operating Span
Operating span (Ospan; Turner & Engle, 1989) is a metric of working memory which involves the retention of words while performing concurrent mathematical problems. It has been shown to correlate with a wide yet somewhat sporadic range of psychological functioning and outcomes such as early onset Alzheimer’s, stress coping, and alcohol consumption (Unsworth, Heitz, Schrock, & Engle, 2005).
In the automated Ospan, participants used the mouse to respond to math equations and identify strings of memorized letters. On each trial, a letter is shown on the screen for 800msec. Then, an unsolved math operation is shown. The participant was instructed to click the mouse once she solved the operation. The operation was cleared from the screen and replaced by a number. The participant signaled whether the number was the correct solution to the operation by clicking on buttons labeled "True" or "False". Next, a new letter is shown. After a determined set of letters had been shown, the participant was presented with a matrix of letters and was instructed to recall the previous string of letters. The experiment includes three sets of each string size from 3 to 7, resulting in 75 trials. The Ospan score was calculated using only strings which were successfully recalled without error. The total number of trials from these successful sets was summed into one final score. The task takes approximately 10 minutes to complete.
Matlab code for running and scoring the Ospan task is available in the download section.
Balloon Analog Risk Taking Task (BART)
The Balloon Analog Risk Taking Task (BART) involves decisions regarding when to cash in on monotonically increasing rewards for which the risk of losing the entire reward increases as well (Lejuez, et al., 2002). The scenario is depicted graphically with an ever expanding balloon that pops when it reaches a predetermined size drawn from a normal distribution around a mean size (unknown to the participant). The optimal strategy (i.e., the optimal ration of risk to reward) converges on a pop rate of 50%. Risky strategies will have higher pop rates, while conservative strategies will have lower pop rates. Pop rate, as well as other available task metrics, have been found to correlate with sensation seeking, impulsivity, constraint deficiencies, and self reported risky behavior such as addictive, health, and safety risks (Hunt, Hopko, Bare, Lejuez, & Robinson, 2005).
The experiment consists of 10 balloons, with each balloon ending when either the balloon pops or the participant decides to cash in on the reward. At the beginning of each balloon, the temporary amount of reward collected returns to 0, while the cumulative amount of collected reward remains on the screen. On each trial, the participant chooses to either pump the balloon to cash in on the reward. On the first trial, if the participant chooses to pump the balloon, it will explode with a probability of 1/128. The probability of explosion is 1/127 on the second trial, 1/126 on the third trial, etc. On the 128th trial, the balloon always explodes. Thus, the average breakpoint was at 64 pumps. The task took approximately 8 minutes to complete.
Adobe Flash code for running the BART is located in the download section. Data files are stored locally in a single appended file in the Flash folder in Documents and Settings. This file must be modified slightly before analysis can be performed. First, the header must be removed. Second, the file must be saved as a readable text file. The columns are as follows:
- Participant Number
- Block
- Trial
- Pop probability
- Current reward
- Cumulative reward
- Response (1 = Yes, 0 = No)
- RT msec
Matlab code for analyzing the BART data file is available in the download section. The resulting data file has one row per participant, with the following output:
- Participant Number
- Number of pops
- Number of accepts
- Proportion of pops
- Average length of pops (Note that this will be NaN if there were no pops)
- Average length of accepts
Task Counterbalancing
Tasks were counterbalanced using a Latin square, with the task ordering maintained on each session. Note that the MMI was only used on pre-test (1st session) and follow-up (4th session). Each row represents one participant's ordering. Thus, nine different orders were used.
| Day1 | Day2 | |||||||
| MMI | Stroop/DigitSpan | Ospan | Visual Search | Multitasking | Filtering | ANT | Task Switching | BART |
| Ospan | MMI | Multitasking | Stroop/DigitSpan | ANT | Visual Search | BART | Filtering | Task Switching |
| Multitasking | Ospan | ANT | MMI | BART | Stroop/DigitSpan | Task Switching | Visual Search | Filtering |
| ANT | Multitasking | BART | Ospan | Task Switching | MMI | Filtering | Stroop/DigitSpan | Visual Search |
| BART | ANT | Task Switching | Multitasking | Filtering | Ospan | Visual Search | MMI | Stroop/DigitSpan |
| Task Switching | BART | Filtering | ANT | Visual Search | Multitasking | Stroop/DigitSpan | Ospan | MMI |
| Filtering | Task Switching | Visual Search | BART | Stroop/DigitSpan | ANT | MMI | Multitasking | Ospan |
| Visual Search | Filtering | Stroop/DigitSpan | Task Switching | MMI | BART | Ospan | ANT | Multitasking |
| Stroop/DigitSpan | Visual Search | MMI | Filtering | Ospan | Task Switching | Multitasking | BART | ANT |
Battery Scoring Program
There is Matlab code available in the download section which will score all of these tasks and aggregate the results (along with raw data) into a single data structure. The data structure can be easily saved and edited. This program allows for all the data to be re-scored quickly if changes to the analysis programs are required. The structure is organized as follows:
data = 1x345 struct array with
fields:
A
B
F
I
M
O
S
D
V
W
info
To call the data for a specific participant (e.g., participant # 227), use the following format:
data(227)
For example, to retrieve the results for the Visual Search task for participant # 227, use:
data(227).V
Each field contains information from Pre-test, Mid-test, Post-test, and for some participants, a Follow-up test.
Data Repository
Downloads
Psychological Task Battery data and Video Game Play data is available. Data from 20 expert StarCraft players is also available for download.
Data is compressed using 7-zip (Contact coggamedata@gmail.com for passwords to unlock the compressed folders).
| Descriptions | Download Link | Last Update |
| Participant Information |
|
12 OCT 2012 |
| Psychological Task Battery Raw Data |
|
12 OCT 2012 |
| Psychological Task Battery Analyzed Results |
|
12 OCT 2012 |
| Psychological Task Battery Experiment and Analysis Programs (Matlab, E-Prime) |
|
12 OCT 2012 |
| StarCraft Game Play Data | For FTP download access, email coggamedata@gmail.com | 18 JUN 2013 |
| StarCraft Game Data Analysis Programs (Matlab) |
|
12 OCT 2012 |
|
StarCraft BWAPI 2.8 Code, BWAPI Compiled DLL (Java), and Custom Level Maps |
|
12 OCT 2012 |
Psychological Task Battery Results
| Task Name | Variable Name | Description |
| ANT | acc | accuracy |
| rt | mean rt | |
| rtCorrect | mean rt for correct responses | |
| rt_sd | rt standard deviation | |
| rtCorrect_sd | rt standard deviation for correct responses | |
| frt_r | correlation of reaction time to fixation time, r value | |
| frt_p | correlation of reaction time to fixation time, p value | |
| RT_incongruent | rt for incongruent trials | |
| RT_congruent | rt for congruent trials | |
| RT_nocue | rt for no cue trials | |
| RT_centercue | rt for center cue trials | |
| RT_spatialcue | rt for spacial cue trials | |
| Exec_Control | executive control score | |
| Alerting | alerting score | |
| Orienting | orienting score | |
| Exec_Control_scale | executive control score | |
| Alerting_scale | alerting score | |
| Orienting_scale | orienting score | |
| rt_median | rt median | |
| rt_removeoutliers | rt with outliers removed | |
| rtCorrect_removeoutliers | mean rt for correct responses with outliers removed | |
| rtCorrect_sd_removeoutliers | standard deviation rt for correct responses with outliers removed | |
| DriftRate | EZ diffusion drift rate | |
| BoundSeparation | EZ diffusion bound separation | |
| NonDecisionTime | EZ diffusion non-decision time | |
| BART | numpops | number of balloon pops |
| numaccepts | number of balloon accepts | |
| popprop | proportion of balloon pops | |
| poplen | mean length of balloon pop (0.5 is 64 trials) | |
| acceptlen | mean length of acceptance (0.5 is 64 trials) | |
| reject | BART reject | |
| Filter | acc | mean accuracy |
| rt | mean rt (outliers removed) | |
| rt_sd | standard deviation rt | |
| rt_median | median rt | |
| rt_correct | mean rt for correct responses (outliers removed) | |
| rt_sd_correct | standard deviation rt for correct responses | |
| typeRB_acc | mean accuracy when R targets, B distractors | |
| typeRB_rt | mean rt (outliers removed) when R targets, B distractors | |
| typeRB_rt_sd | standard deviation rt when R targets, B distractors | |
| typeRB_rt_median | median rt when R targets, B distractors | |
| DriftRate | EZ diffusion drift rate | |
| BoundSeparation | EZ diffusion bound separation | |
| NonDecisionTime | EZ diffusion non-decision time | |
| MMI | score | MMI score |
| hours | MMI hours per week | |
| reject | MMI reject | |
| Multitask | ACC | mean accuracy |
| ACC_1 | switch accuracy | |
| ACC_2 | nonswitch accuracy | |
| ACC_cost | accuracy switch cost (switch minus nonswitch) | |
| RT | mean rt (outliers removed) | |
| RT_Switch | mean rt for switches | |
| RT_NonSwitch | mean rt for nonswitches | |
| RT_cost | mean rt switch cost (switch minus nonswitch) | |
| RT_correct | mean rt for correct responses | |
| RTsd | standard deviation rt | |
| RTsd_Switch | standard deviation rt for switches | |
| RTsd_NonSwitch | standard deviation rt for nonswitches | |
| RTsd_cost | standard deviation rt switch cost | |
| RTsd_correct | standard deviation rt for correct trials | |
| RTmedian | median rt | |
| DriftRate | EZ diffusion drift rate | |
| BoundSeparation | EZ diffusion bound separation | |
| NonDecisionTime | EZ diffusion non-decision time | |
| Ospan | score | Ospan score |
| reject | Ospan reject (score < 10) | |
| Stroop | z | Stroop Interference Z-score |
| DigitSpan | z | Digit Span Z-score |
| VisualSearch | rt | mean rt (outliers removed) |
| rtsd | standard deviation rt | |
| rt_easy | mean rt for easy trials | |
| rtsd_easy | standard deviation rt for easy trials | |
| rtmedian | median rt | |
| rt_hard | mean rt for hard trials | |
| rtsd_hard | standard deviation rt for hard trials | |
| acc | accuracy | |
| acc_easy | accuracy for easy trials | |
| acc_hard | accuracy for hard trials | |
| rt_correct | mean rt for correct trials | |
| rtsd_correct | standard deviation rt for correct trials | |
| DriftRate | EZ diffusion drift rate | |
| BoundSeparation | EZ diffusion bound separation | |
| NonDecisionTime | EZ diffusion non-decision time | |
| TaskSwitching | acc | accuracy |
| switchacc | switch accuracy | |
| noswitchacc | nonswitch accuracy | |
| rt | mean rt (outliers removed) | |
| rt_sd | standard deviation rt | |
| rt_median | median rt | |
| rt_correct | mean rt for correct responses | |
| rt_correct_sd | standard deviation rt for correct trials | |
| switchrt | mean rt for switches | |
| switchrt_sd | standard deviation rt for switches | |
| noswitchrt | mean rt for nonswitches | |
| noswitchrt_sd | standard deviation rt for nonswitches | |
| switchcostacc | accuracy switch cost (switch minus nonswitch) | |
| switchcostrt | mean rt switch cost (switch minus nonswitch) | |
| DriftRate | EZ diffusion drift rate | |
| BoundSeparation | EZ diffusion bound separation | |
| NonDecisionTime | EZ diffusion non-decision time | |
| ParticipantInfo | Sub | Participant Number |
| Gender | (2=Female) | |
| Cond | Condition (1= SC-1, 2= SC-2, 3=The Sims) | |
| Cond2 | Game Condition (1=StarCraft, 2=TheSims) | |
| Exist | Data exists (1=Yes, 0=No) | |
| DropOut | Dropped out from study (1=Yes) | |
| Sgames | Number of games played (StarCraft) | |
| Swins | Number of games won (StarCraft) | |
| Swinrate | Proportion of games won (StarCraft) | |
| Slevmap1 | Level achieved for Map 1 (StarCraft) | |
| Slevmap2 | Level achieved for Map 2 (StarCraft) | |
| Slev | Mean level achieved (StarCraft) | |
| SlevZ | Level achieved Z-score (StarCraft) |
Variable Name Prefix Explanation
- Variables have a prefix to identify 1) the task and 2) the session. There are also difference scores.
- Session scores
- These are absolute scores that represent the measure at a given session
- Example: A1_acc: A = ANT, 1 = 1st Session
- Example: F3_rt: F = Filter, 3 = 3rd Session
- Difference scores
- These are difference scores between two different sessions
- Example: Bd31_acceptlen: B = BART, d31 = 3rd Session minus 2nd Session
- Example: Wd21_rt_correct: W = Task Switching, d21 = 2nd Session minus 1st Session
- Task Prefix Codes:
- A = ANT
- B = BART
- D = Digit Span
- F = Information Filtering
- I = MMI
- M = Multi-location Memory
- O = Ospan
- S = Stroop
- W = Task Switching
- V = Visual Search
Contact
Brian D. Glass, Ph. D.
briglass@gmail.comBradley C. Love, Ph.D.
bradley.c.love@gmail.comW. Todd Maddox, Ph.D.
maddox@psy.utexas.edu
References
Basak, C., Boot, W. R., Voss, M. W., & Kramer, A. F. (2008) Can training in a real-time strategy video game attenuate cognitive decline in older adults? Psychology and Aging, 23, 756-777.
Braver, T. S., Barch, D. M., Keys, B. A., Carter, C. S., Cohen, J. D., Kaye, J. A., et al. (2001). Context processing in older adults: Evidence for a theory relating cognitive control to neurobiology in healthy aging. Journal of Experimental Psychology: General, 130, 746–763.
Botvinick, M., Braver, T. S., Barch, D. M., Carter, C. S., & Cohen, J. D. (2001). Conflict monitoring and cognitive control. Psychological Review, 108, 624–652.
Castel, A.D., Pratt, J., & Drummond, E. (2005). The effects of action video game experience on the time course of inhibition of return and the efficiency of visual search. Acta Psychologica, 119, 217–230.
Charron, S. & Koechlin, E. (2010). Divided representation of concurrent goals in the human frontal lobes. Science, 328, 360–363.
Dye, M.W.G., Green, C.S., Bavelier, D. (2009). Increasing speed of processing with action video games. Current Directions in Psychological Science, 18, 321-326.
Fan, J., McCandliss, B. D., Sommer, T., Raz, A. & Posner, M. I. Testing the efficiency and independence of attentional networks. Journal of Cognitive Neuroscience. 14, 340–347 (2002).
Granek, J. A., & Gorbet, D. J. (2009). Extensive video-game experience alters cortical networks for complex visuomotor transformations. Cortex, 46, 2010.
Green, C.S. & Bavelier, D. (2007). Action video game experience alters the spatial resolution of attention. Psychological Science, 18, 88-94.
Green, C. S., & Bavelier, D. (2008). Exercising your brain: A review of human brain plasticity and training-induced learning. Psychology and Aging, 23, 692–701.
Green, C. S., Pouget, A., & Bavelier, D. (2010). Improved probabilistic inference, as a general learning mechanism with action video games. Current Biology, 20, 1573-15792.
Howieson, Diane Black; Lezak, Muriel Deutsch; Loring, David W. (2004). "Orientation and attention". Neuropsychological assessment. Oxford [Oxfordshire]: Oxford University Press. pp. 3365–367
Hunt, M. K., Hopko, D. R., Bare, R., Lejuez, C. W., & Robinson, E. (2005). Construct Validity of the Balloon Analog Risk Task (BART): Associations With Psychopathy and Impulsivity. Assessment, 12, 416-428.
Lejuez, C. W., Read, J. P., Kahler, C. W., Richards, J. B., Ramsey, S. E., Stuart, G. L., Strong, D. R., & Brown, R. A. (2002). Evaluation of a behavioral measure of risk-taking: The Balloon Analogue Risk Task (BART). Journal of Experimental Psychology: Applied, 8, 75-84.
Love, B. C., Jones, M., Tomlinson, M.T., & Howe, M. (2008). Predicting Information Needs: Adaptive Display in Dynamic Environments . Proceedings of the Cognitive Science Society. Mahwah, NJ: Lawrence Erlbaum Associates.
Mirsky, A.F., Anthony, B.F., Duncan, C.C., Ahearn, M.B., & Kellam, S.G. (1991). Analysis of the elements of attention: A neuropsychological approach. Neuropsychological Review, 2, 109-145.
Monsell, S. (2003) Task switching. Trends in Cognitive Science, 7, 134–140.
Ophir, E., Nass, C., & Wagner, A. D. (2009). Cognitive control in media multitaskers. Proceedings of the National Academy of Sciences, 106, 15583–15587.
Pashler, H. (2000). Task switching and multitask performance. In Monsell, S., and Driver, J. (editors). Attention and Performance XVIII: Control of mental processes. Cambridge, MA: MIT Press.
Posner, M.I., & Rothbart, M.K. (2007). Research on attention networks as a model for the integration of psychological science. Annual Review of Psychology, 58, 1–23.
Posner, M. I., Sheese, B. E., Odludas, Y., & Tong, Y. (2006). Analyzing and shaping human attentional networks. Neural Network, 19, 1422–1429.
Raz, A., & Buhle, J. (2006). Typologies of attentional networks. Nature Reviews Neuroscience, 7, 367-379.
Rueda, M., Rothbart, M., McAndliss, B., Saccomanno, L., & Posner, M. (2005). Training, maturation, and genetic influences on the development of executive attention. Proceedings from the National Academy of Sciences, 102, 14931–14936.
Schmidt, N. B., Richey, J. A., Buckner, J. D., Timpano, K. R. (2009).Attention training for generalized social anxiety disorder. Journal of Abnormal Psychology, 118, 5–14.
Stroop, J. R. (1935). Studies of interference in serial verbal reactions. Journal of Experimental Psychology, 18, 643-662.
Subrahmanyam, K., & Greenfield, P.M. (1994). Effect of video game practice on spatial skills in girls and boys. Journal of Applied Developmental Psychology 15, 13-32.
Tang Y. Y. & Posner, M. I. (2009) Attention training and attention state training. Trends in Cognitive Science, 13, 222–227.
Turner, M. L., & Engle, R. W. (1989). Is working memory capacity task dependent? Journal of Memory & Language, 28, 127-154
Unsworth, N., Heitz, R. P., Shrock, J. C., & Engle, R. W. (2005). An automated version of the operation span task. Behavior Research Methods, Instruments, & Computers, 37, 498–505.
Vogel E-K, McCollough A-W,Machizawa M-G (2005) Neural measures reveal individual differences in controlling access to working memory. Nature, 438, 500–503.
Wechsler, D. (2008). Wechsler Adult Intelligence Scale—4th Edition (WAIS-IV®). San Antonio, TX: Harcourt Assessment.